In CatWalk 10.7 we changed how phase dispersion and coupling are visualized and calculated. Here is what that means for interpreting values, running statistics, and reporting results.
The most misunderstood parameter in rodent gait analysis
Phase dispersion and coupling are two of the most valuable parameters CatWalk reports. They capture interlimb coordination, the temporal relationship between paws during a step cycle, which is fundamental to detecting motor deficits in models of spinal cord injury, ataxia, Parkinson's, Huntington's, stroke, and many other CNS and PNS conditions.
They are also the two most misunderstood parameters in the software.
The confusion is not the user's fault. Phase dispersion is circular data, meaning it lives on a loop rather than a line, and circular data requires different mathematics than most researchers are trained on. Nearly every commercial gait analysis system, including previous versions of CatWalk, has historically presented these parameters as if they were linear. That approach usually works. Occasionally it produces averages and p-values that quietly point in the wrong direction.
In CatWalk 10.7 we fixed this. Here is what changed, why it matters, and how to read the new values.
What phase dispersion measures
Phase dispersion answers one question: when one paw completes its step cycle, at what point in that cycle does another paw make initial contact with the ground?
Pick one paw as the anchor (its cycle sets the reference clock) and another as the target. The value is expressed as a percentage of the anchor's cycle.
A quick example. The right front paw's step cycle lasts 20 milliseconds. The left hind paw makes initial contact 15 milliseconds into that cycle. Phase dispersion = 15 / 20 = 75 percent.
Both phase dispersion and coupling report this same underlying value. Coupling is the unsigned version, always 0 to 100 percent. Phase dispersion is the signed version, which becomes important the moment you try to compute an average.
Reference values worth knowing
For a healthy rodent walking at moderate speed, the expected values follow a clear pattern:
| Paw pair |
Combinations |
Expected value |
What this means |
| Diagonal |
LF-RH, RF-LH |
~0 percent (or ~100 percent) |
Near-synchronous contact |
| Girdle |
LF-RF, LH-RH |
~50 percent |
Alternating (front pair or hind pair) |
| Lateral |
LF-LH, RF-RH |
~50 percent |
Alternating (same side of body) |
Any deviation from these reference points signals a change in coordination. Diagonal drift away from 0 percent flags a problem in forelimb to hindlimb coordination. Girdle drift away from 50 percent flags left-right asymmetry, such as a limp or a hemiparetic gait. Lateral drift away from 50 percent flags ipsilateral coordination issues, often cerebellar or spinal in origin.
A real example: geriatric vs young mice
The worked example above is useful for understanding the math, but real CatWalk data tells the story better. The figures below compare a group of geriatric mice with a group of young mice on two paw pairs.
How to read the circular graphs. The 0 percent reference sits at the top of the circle. Values increase clockwise to +50 at the bottom, then continue counterclockwise from -50 back up to 0. The bottom of the circle, labeled -50|50, is the wrap point where the two labels describe the same instant: perfect alternation. The red arrow is the group's circular mean. Its direction gives the average timing relationship, and its length reflects how tightly the individual runs are clustered around that mean.
For a healthy rodent at moderate walking speed, we expect the arrow to sit near 0 for diagonal pairs (paws that normally strike the ground together) and near ±50 for girdle pairs (paws that normally alternate).
Diagonal pair: RF → LH
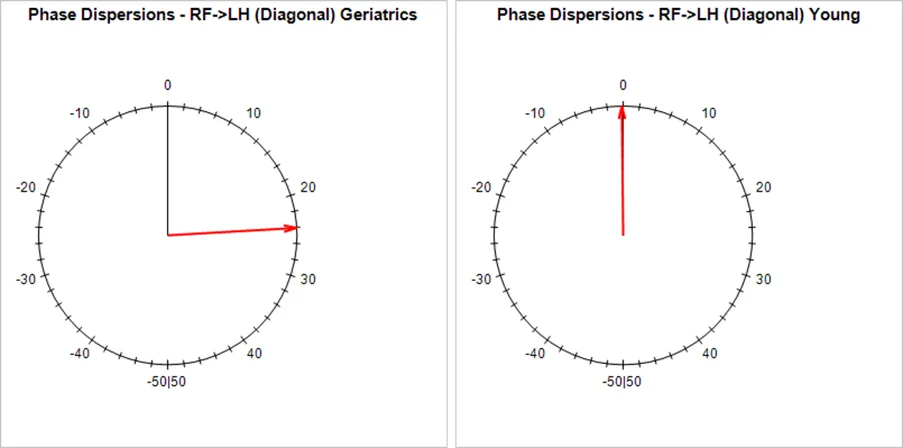
Diagonal pair (RF → LH). The young group's mean arrow points to 0; the geriatric group has rotated roughly 24 percent clockwise.
The young group is textbook. The mean arrow points almost exactly to 0. Diagonal coordination is intact and the forelimb and hindlimb are striking the ground in near-synchrony as expected.
The geriatric group has shifted. The mean arrow has rotated roughly 24 percent clockwise, meaning the left hind paw is now landing about a quarter of the way into the right front paw's cycle rather than in near synchrony. The animals are consistently coordinating differently, which is exactly the kind of stable, biologically meaningful phenotype gait analysis should be able to detect.
Girdle pair: LH → RH
Again, the young group behaves as expected. The mean arrow points essentially straight down, sitting on the ±50 alternation point.
The geriatric group has shifted counterclockwise to roughly -38 percent, which corresponds to 62 percent on a linear 0 to 100 percent scale. Alternation is still present, but it is no longer symmetric. The left hind is arriving later in the right hind's cycle than it should.
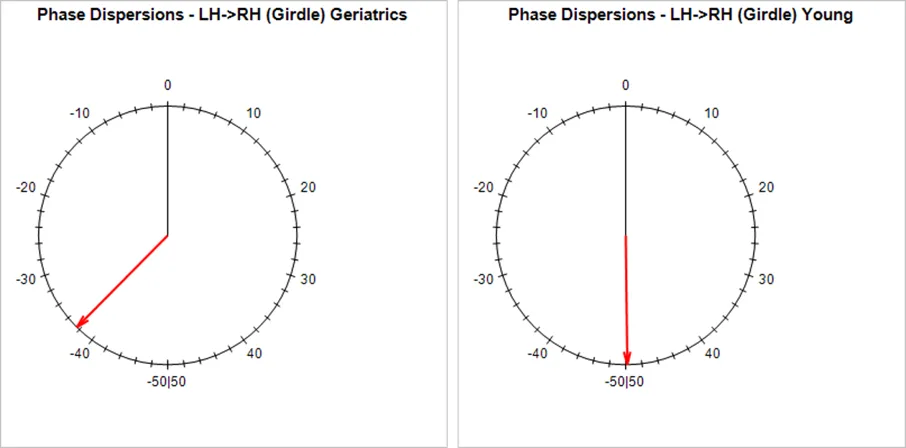
Girdle pair (LH → RH). The young group sits on the ±50 alternation point; the geriatric group has shifted to roughly -38 percent.
What this tells us. Both paw pairs show age-related deviation, but the diagonal shift is the larger one. This is consistent with what we know biologically: forelimb-hindlimb coordination is a pattern that tends to degrade before the more automatic left-right alternation. The circular graphs show that pattern immediately.
Now consider what a linear analysis would have shown for the same data. Individual diagonal readings in the young group include values on both sides of the 0 / 100 wrap point, because near-synchronous contacts naturally fall to either side depending on which paw touched down first by a millisecond. A linear average of those values would sit somewhere in the middle of the number line, far from where the coordination actually lives on the circle. The age-related shift in the geriatric group would either disappear into noise or produce a spurious result. The circular representation shows the truth. The linear one hides it.
The circular data problem
Here is why linear averaging can go wrong. The step cycle is inherently repetitive. The moment labeled 0 percent (the start of the cycle) is the same instant labeled 100 percent (the end). On a linear axis those points are far apart. On a circle they are the same point.
Consider four phase dispersion values from a single trial: 75, 75, 5, 5.
- Linear mean: (75 + 75 + 5 + 5) / 4 = 40 percent
- Circular mean: 90 percent (equivalently, -10 percent)
The linear mean of 40 percent is misleading. It sits on the opposite side of the circle from where all four values are clustered. The circular mean correctly identifies the group as clustered near the 0 / 100 wrap point.
This is exactly the situation that shows up in real data for diagonal paw pairs, whose expected values sit right at 0 percent. A healthy animal's diagonal readings across a single trial might include 98, 2, 99, and -3 percent. These are all near-synchronous contacts, but a linear average treats them as wildly inconsistent.
What CatWalk 10.7 changed
Three concrete updates:
- Circular means are now the default. Group statistics computed inside the software use the correct circular calculation. Users pulling group statistics get accurate averages without writing custom code in R or Python.
- Phase dispersion now uses signed values. Values can go negative because they live on a circle. A value of -19 percent and a value of 81 percent describe the same point on the cycle. The signed representation makes clusters near the wrap point visually obvious in a way that a 0 to 100 percent scale cannot.
- Results are displayed on circular graphs. Phase dispersion values plot around a circle rather than a line, matching the underlying mathematics.
Coupling remains available in its familiar 0 to 100 percent form for users and downstream tools that expect a positive number. The underlying data is the same. Only the display differs.
Why this matters for your research
For most girdle and lateral pair analyses, the practical difference between linear and circular statistics is small. Those values cluster near 50 percent, well away from the wrap point, and a t-test will usually reach the same conclusion either way.
For diagonal pairs, and for any experimental group whose values cluster near 0 or 100 percent, the difference can be substantial. Ataxia models, spinal cord injury studies, and neurodegeneration research frequently produce exactly this kind of data. In these cases a linear analysis can hide a real effect or invent one that is not there.
Reviewers are increasingly aware of the distinction. Reporting a circular mean alongside a Watson-Williams or Watson's U² test is defensible in a way that a t-test on circular data no longer is.
The bigger picture
Phase dispersion has always been circular data. The mathematics have been settled in the circular statistics literature for decades. What has been missing is a commercial system that applies the correct methodology automatically, so researchers can focus on biology instead of writing custom scripts to compute a mean.
To our knowledge, CatWalk 10.7 is currently the only commercial rodent gait platform that reports interlimb coordination using circular means and circular graphs out of the box. Every other system on the market, whether treadmill-based or runway-based, still presents these parameters on a linear scale, leaving the correct statistical treatment to the researcher.
If you are already using CatWalk, the upgrade is available now. If you are evaluating gait analysis systems for a new lab or core facility, this is one of the differences that will show up in your first manuscript.
Want a deeper reference on interpreting phase dispersion, coupling, and the appropriate statistical tests? See our full knowledge base article on MyNoldus.
CatWalk XT
Getting CatWalk for your research has never been easier
Find out how to get the best deal on CatWalk, the automated gait analysis system trusted in motor-deficit research worldwide.
See the deal
arrow_forward