How does the anchor geometry affect tracking precision across the tracking site?
Last updated: Aug 24, 2026
This article discusses tracking precision. View this article to learn about the difference between tracking precision and accuracy.
When the accuracy of the TrackLab/Sewio UWB system comes into play, the anchors’ placement geometry has a key role. This article is intended to give insight into how the anchor geometry affects the precision across the tracking site.
A general mathematical model for evaluation of localization precision is the Dilution of Precision (DOP) model, which will be used to illustrate how precision is affected in 2 examples:
- Square anchor geometry (optimal for tracking precision)
- Rectangular anchor geometry, with an aspect ratio of 20:3 (x:y). Note: the anchor placement rules say the aspect ratio must not exceed 3:1. This example merely serves to illustrate how the precision is affected if you ignore these rules.
Example 1) SQUARE geometry
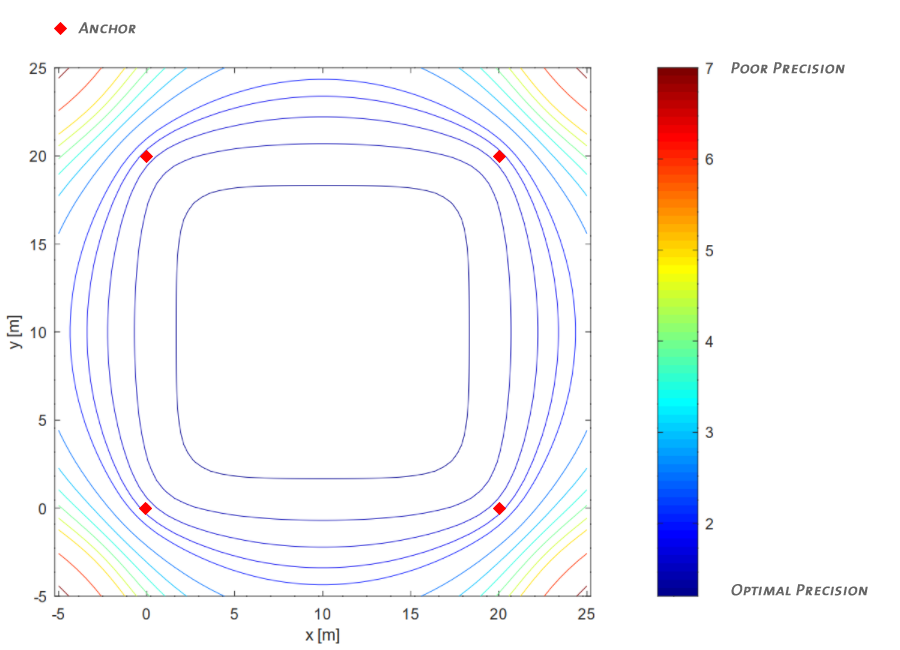
The below image illustrates how the precision across the tracking area changes, depending the location. The lines connect areas with the same precision. The precision is expressed by the 'gain' factor. Dark blue stands for optimal precision, whereas red indicates poor precision. You can immediately see that precision is generally good in the area encompassed by the anchors. The area below the anchors already shows slightly less precision. Behind the anchors, in the corners (largest distance to furthest anchor) shows the poorest precision.
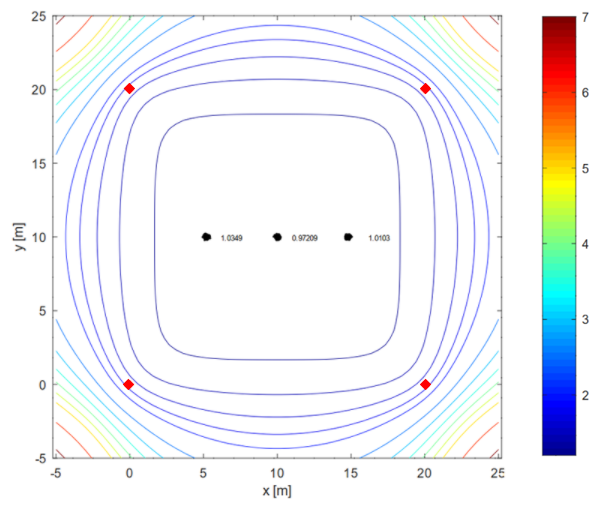
We can illustrate how this theoretic model translates to a real-world measurement. In the below image, the measured location of 500 consecutive samples are plotted, for 3 tags on different locations within the area enclosed by the anchors. You can see how the plot 'clouds' remains small and compact, indicating a high precision of repeated tag localizations.
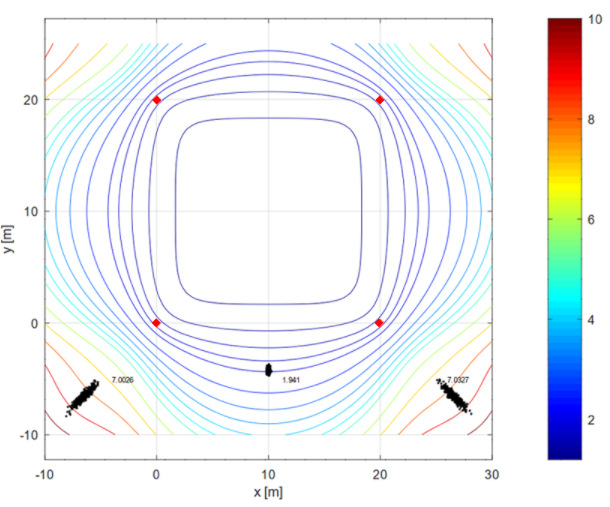
If we now do the same for 3 locations outside the area enclosed by the anchors, the result looks like below; especially in the corners behind the anchors the plot clouds are bigger where the model predicts poor precision:
Here are the conclusions for site design:
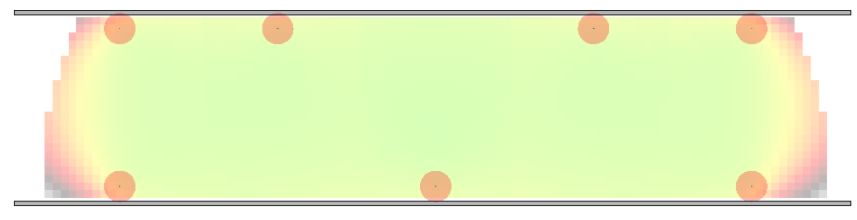
- If possible, place the anchors around the tracking area. For example, if a livestock pen has surrounding pathways, place the anchors such that they include the pathways in the tracking area.
- Apply Areas of Interest inside the area enclosed by the anchors.
- Note: in practice, you will se a reduced precision in the corners of the tracking area, also directly below the anchors. Sometimes the anchors can not be placed outside the tracking area, for instance when a livestock pen is directly bordered to walls. You then need to mount the anchors onto the walls and since the anchors need to be mounted at least 30cm from the wall, this will lead to slightly reduced precision below the anchors. However, in most TrackLab applications this will not be a practical problem since the subjects tend to not move all the way into the corners. It is still something to consider in certain situations.
Example 2) RECTANGULAR anchor geometry
In this example, the anchors on the x-axis are much further apart than the anchors in the direction of the y-axis. The aspect ratio (AR) in this example is 20:3 meters. Remember that this AR goes against the anchor placement rule that says that the anchor AR shall be 3:1 (x:y) at maximum. This example is intended to merely demonstrate what the effect on precision would be should you ignore the rule. The below image again shows the Dilution of Precision model, including 500 location plots of 3 tags each (the black plot clouds). You immediately see how especially the precision on the 'short side' of the tracking area (the y-axis) is compromised. The precision on the x-axis is unaffected. In some use cases where only the precision in x-direction is important, this geometry does not have to pose a problem. For example if you want to know how far up the hallway of a museum a visitor has progressed. In other applications it may be a problem for example if you want to know if a supermarket shopper is in proximity to either left or right side shelves of an aisle.
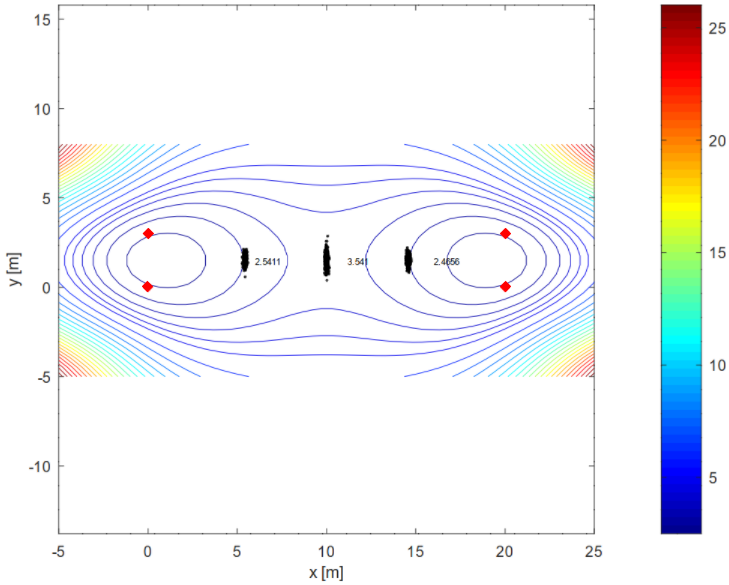
What to do if your customer wants to track subjects in such a narrow area, and a decent precision on the y-axis (short side) is required? You can solve this problem by adding extra anchors and adjusting the geometry, for instance like below (red dots are anchors):