FaceReader FairFace Validation: Reducing Bias in Facial Expression Analysis
Last updated: Jul 24, 2026
FaceReader 9 - FairFace Validation

What is FaceReader?

Emotions are an important aspect of human life. They instinctively influence our behaviors and decisions. Our face is often the best indicator for this, as our facial expressions convey emotions without saying a word and can be observed by others. Facial expressions are created with the help of muscle movements beneath the skin of the face. For researchers, emotions are fundamental in understanding human behavior, as they are a crucial part in non-verbal communication and a rich source of social signals.
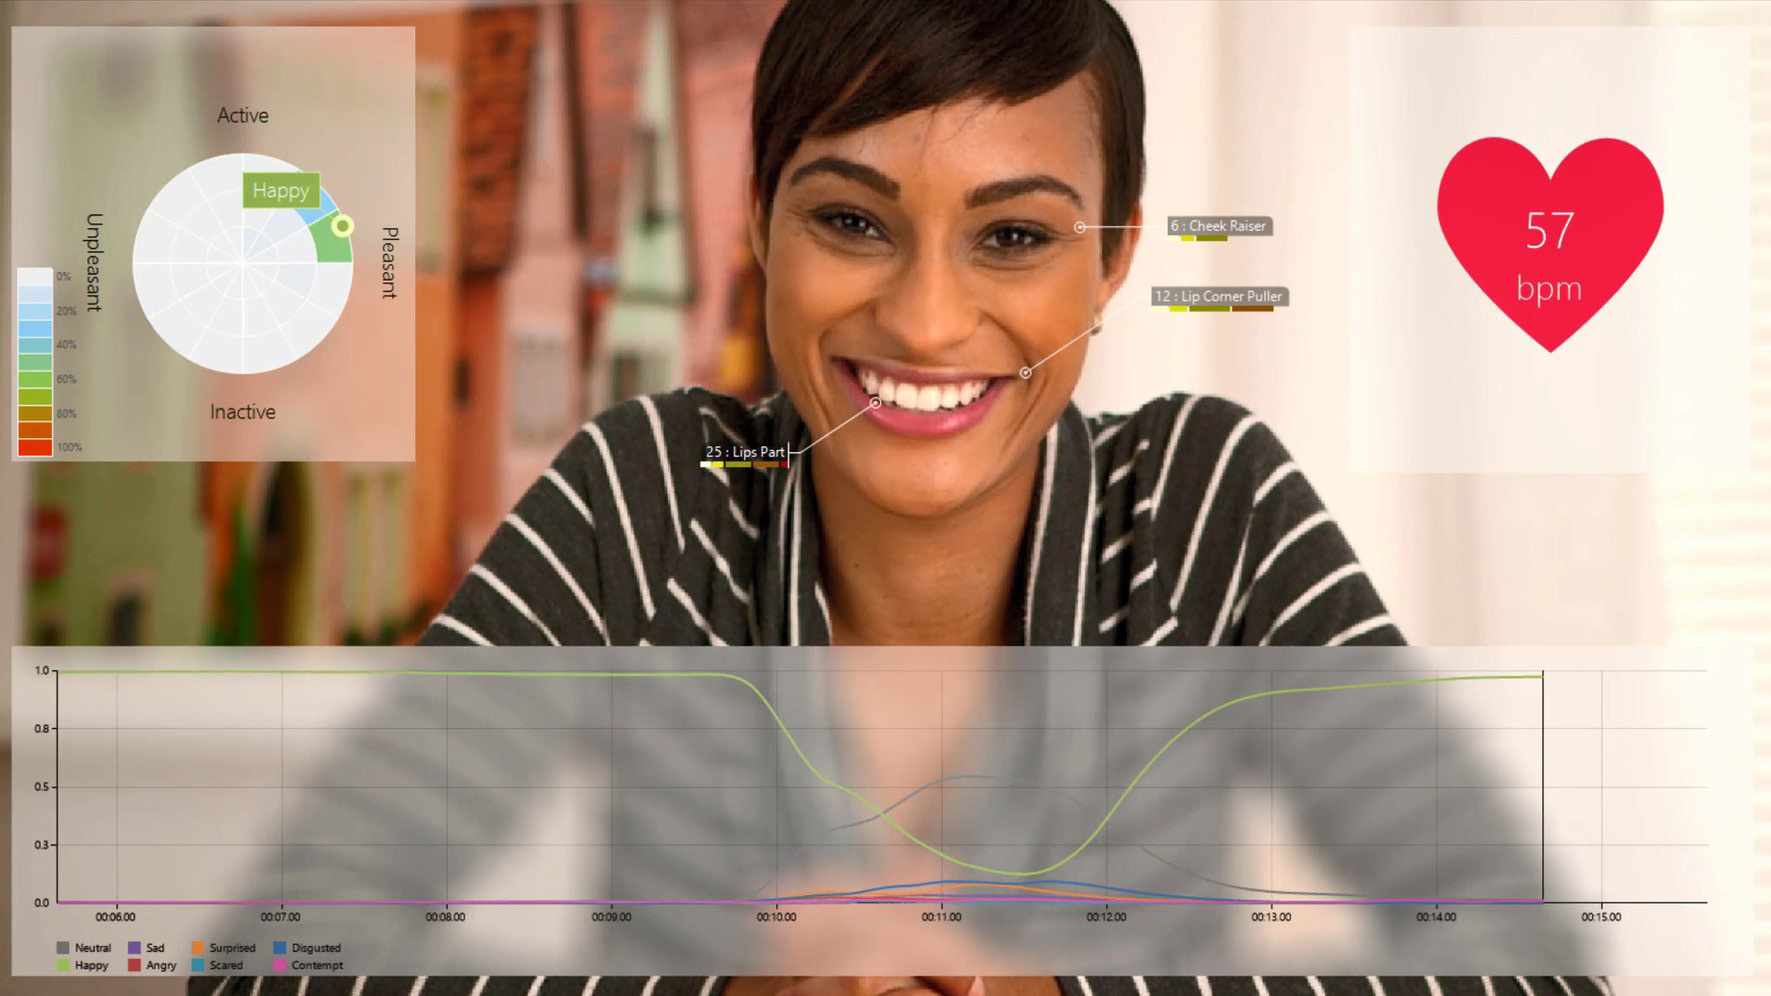
FaceReader is the most robust automated system for the recognition of a number of specific properties in facial images, including the six basic or universal expressions: happy, sad, angry, surprised, scared, and disgusted. Paul Ekman described these emotional categories as the basic or universal emotions. Additionally, FaceReader can recognize a neutral state and analyze contempt. It also calculates Action Units (AUs), valence, arousal, gaze direction, head orientation, and personal characteristics such as gender and age.
Introduction
The academic community generally agrees that there are universal human facial expressions[1]. Within the past fifteen years, many commercial organizations have created automated, software-based, facial expression analysis tools[2]. One such tool, FaceReader 9, uses a Deep Learning network model to characterize facial expression. This model was trained, tested, and validated against facial images demonstrating the basic expressions; however, there are no published data detailing how well FaceReader models faces of varying ethnicity.
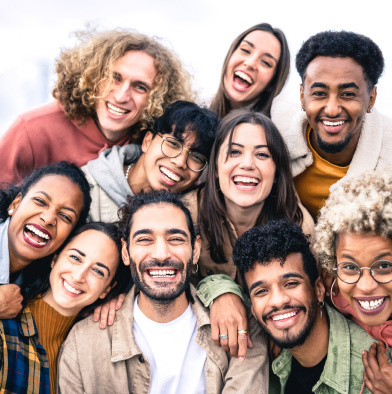
Therefore, the goal of the present validation study was to compare facial images of seven ethnicities contained within the FairFace Face Attribute Dataset[3] in terms of the ability of FaceReader to find and model the face.
How Does FaceReader Work?
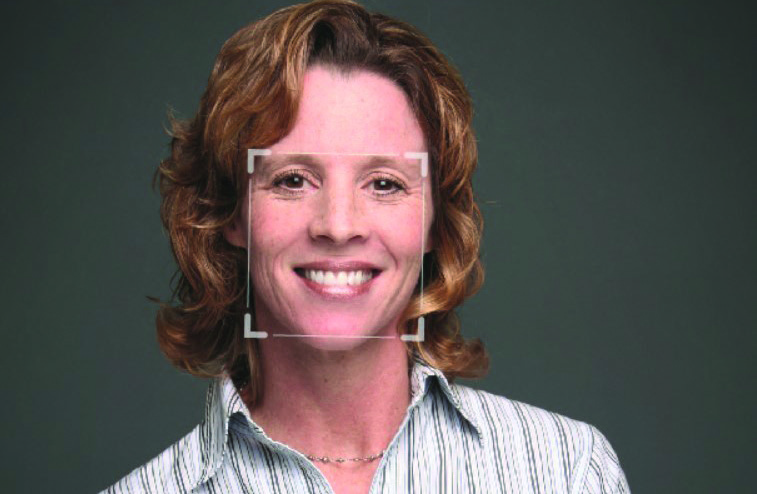
FaceReader determines facial expressions in three steps:
- Face finding - The position of the face in an image is found using a deep learning based face-finding algorithm, which searches for areas in the image having the appearance of a face at different scales.
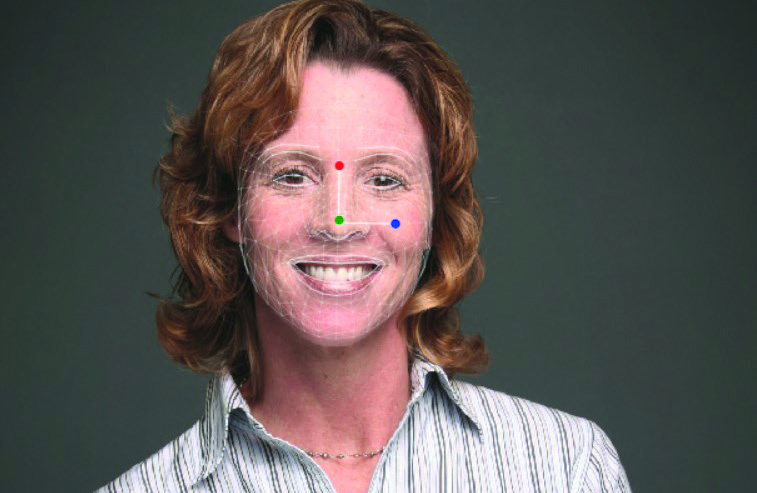
- Face modeling - FaceReader uses a facial modeling technique based on deep neural networks. It synthesizes an artificial face model, which describes the location of 468 key points in the face. It is a single pass quick method to directly estimate the full collection of landmarks in the face. After the initial estimation, the key points are compressed using Principal Component Analysis. This leads to a highly compressed vector representation describing the state of the face. This output is used in step 3.
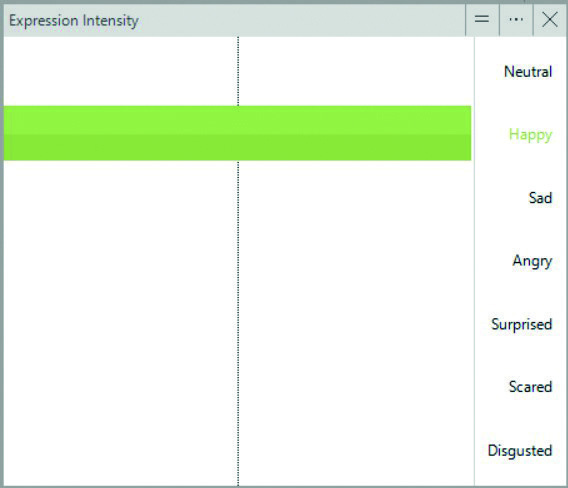
- Face classification - Then, classification of the facial expressions takes place by a trained deep artificial neural network to recognize patterns in the face. FaceReader directly classifies the facial expressions from image pixels. Over 20,000 images that were manually annotated were used to train the artificial neural network.
FairFace Face Attribute Dataset
The dataset used for this validation is FairFace: Face Attribute Dataset for Balanced Race, Gender, and Age that consists of a novel face image dataset containing 108,501 images balanced on ethnicity. Seven (7) groups were identified: Black, Indian, East Asian, Southeast Asian, Middle Eastern, Latino, and White. Images were collected from the YFCC-100M Flickr dataset and labeled with race, gender, and age groups.
Methodology
Testing Procedure
Out of the 108,501 images, a total of 86,744 images of the FairFace training dataset were tested in FaceReader 9. In addition to the expressions displayed, FaceReader 9 also provides a metric of the quality of the image in terms of the program's ability to model the face. This metric ranges from 0-1, with 0.50 being the default minimum value required for a model to be valid.
The goal was to determine if FaceReader 9 could model faces, not determine the expression(s) displayed, i.e., although the expressions were calculated, only the model quality was considered.
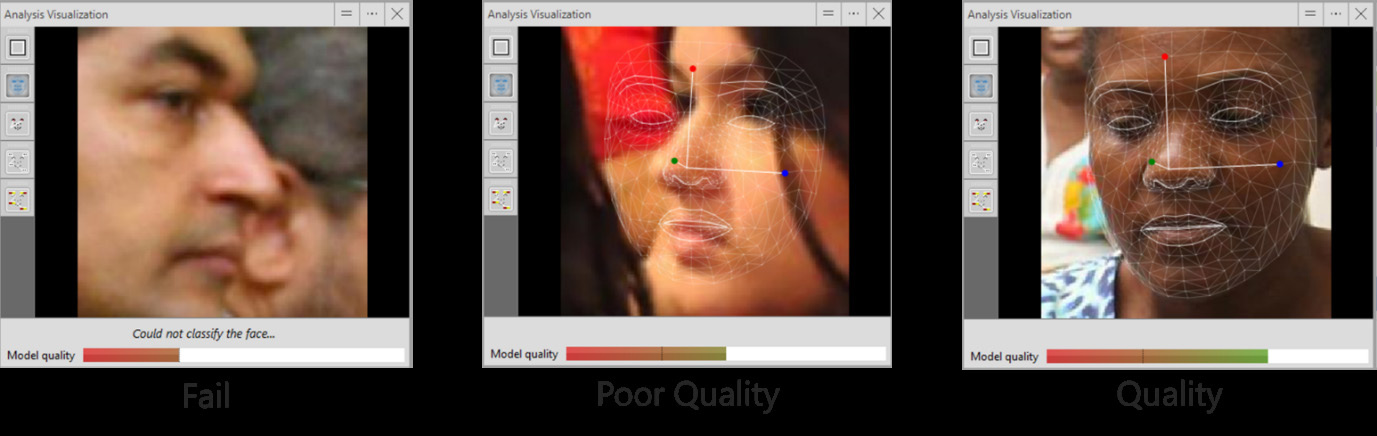
- As described earlier in this document, face modeling refers to the fitting of the 3D key-points on the face (this is what creates the 3D mesh visualization). The output of this face modelling is used to create a normalized/refined face image that is used as input to calculate facial expressions and AUs.
- Model quality refers to the quality of the face modeling (performed in step a). That is, how well the 3D key-points were fit onto the face. As a consequence of this, well fit faces (with high quality score) will likely result in more accurate facial expression/AU calculation; poorly fit faces (with low quality) can result in incorrect facial expressions/AU.
FairFace Dataset Analysis in FaceReader
The FairFace dataset was used primarily as a training tool for face verification and identification. It was the first large scale in-the-wild facial image dataset. As such, the present project could not control for emotional expressions; therefore, the individual expressions were not analyzed. Furthermore, the General face model was used for all images. Detailed data were exported into Excel and merged with the FairFace Label output showing the following columns:
FaceReader
- Image file
- Gender estimate
- Model quality
- Output of the expressions
- Valence and Arousal
FairFace Label
- Image file
- Gender (binary: M/F)
- Ethnicity
Hypothesis and Data Analysis
It was hypothesized that the model quality will not differ by ethnicity, only by resolution, lighting and/or angle of the face. For analyses, the data were categorized into three groups:
- Find Fail: Could not find the face
- Fit Fail: Model quality less than 0.50
- Quality: Model quality equal or greater than 0.50
Results
Overall Results
The total number of images analyzed was 86,744. Of those, FaceReader 9 could not detect a face in 797 images. Furthermore, 16,464 images were of poor quality, which is to say a model quality less than 0.50. Those combined images were excluded from further analyses. The remaining 69,483 images, those whose model quality were equal or higher than 0.50, were analyzed as quality images.
No Difference in Overall Model Quality
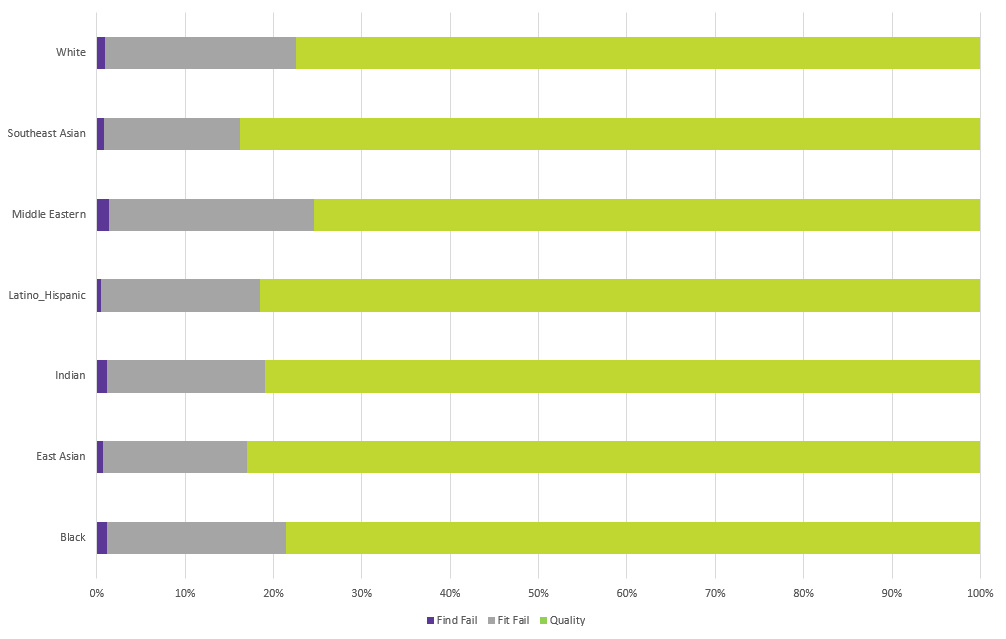
Given the large sample size, effect size was used to determine the strength of the differences among the groups. In an analysis of variance, eta squared (η2) is calculated as the sum of squares for the treatment (i.e., sum of squared differences between a group mean and the grand mean) divided by the total sum of squares. The value of eta squared ranges from 0 to 1, with higher values indicating more of an effect.
Furthermore, a general rule of thumb is that an eta square of 0.1 is a small effect and 0.14 or higher is a large effect. To that end, there were no real differences observed among the ethnicities in this study (η2=0.009), meaning that FaceReader modeled the faces equally. This indicates that FaceReader has no intrinsic biases when it comes to modeling faces.
| Ethnicity | Average Quality | Count |
|---|---|---|
| Black | 0.6430 | 9610 |
| East Asian | 0.6646 | 10193 |
| Indian | 0.6651 | 9979 |
| Latino/Hispanic | 0.6752 | 10893 |
| Middle Eastern | 0.6534 | 6948 |
| Southeast Asian | 0.6688 | 9050 |
| White | 0.6554 | 12810 |
| Grand Total | 0.6651 | 69483 |
| Ethnicity | Total | Find Fail | Fit Fail | Quality | % Find Fail | % Fit Fail | % Quality |
|---|---|---|---|---|---|---|---|
| Black | 12233 | 140 | 2483 | 9610 | 1.46% | 20.30% | 78.56% |
| East Asian | 12287 | 88 | 2006 | 10193 | 0.86% | 16.33% | 82.96% |
| Indian | 12319 | 143 | 2197 | 9979 | 1.43% | 17.83% | 81.00% |
| Latino/Hispanic | 13367 | 70 | 2404 | 10893 | 0.64% | 17.98% | 81.49% |
| Middle Eastern | 9216 | 122 | 2146 | 6948 | 1.76% | 23.29% | 75.39% |
| Southeast Asian | 10795 | 83 | 1662 | 9050 | 0.92% | 15.40% | 83.84% |
| White | 16527 | 151 | 3566 | 12810 | 1.18% | 21.58% | 77.51% |
| Grand Total | 86744 | 797 | 16464 | 69483 | 1.15% | 18.98% | 80.10% |
No Differences Between Male and Female Faces
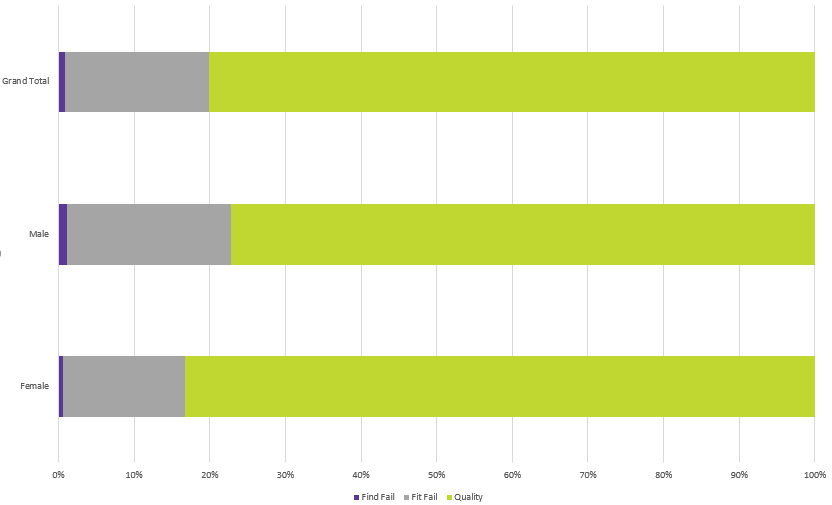
Similar to the ethnicity, there were no real differences between male and female faces (η2=0.010), meaning that FaceReader modeled the faces equally, regardless of gender.
| Gender | Average Quality | Count |
|---|---|---|
| Female | 0.66821 | 33960 |
| Male | 0.65426 | 35523 |
| Grand Total | 0.66107 | 69483 |
| Gender | Total | Find Fail | Fit Fail | Quality | % Find Fail | % Fit Fail | % Quality |
|---|---|---|---|---|---|---|---|
| Female | 40758 | 246 | 6552 | 33960 | 0.72% | 16.08% | 83.32% |
| Male | 45986 | 551 | 9912 | 35523 | 1.55% | 21.55% | 77.25% |
| Grand Total | 86744 | 797 | 16464 | 69483 | 1.15% | 18.98% | 80.10% |
Summary
Overall, this validation study demonstrates that there are no real differences in how FaceReader 9 models faces in the FairFace dataset. As demonstrated by the meaninglessly low effect size, FaceReader 9 equally modeled all faces regardless of ethnicity or gender. This demonstrates that the automated facial expression analysis in FaceReader 9 is not biased for or against any ethnicity or gender when it comes to face modeling, and all faces are modeled equally.
References
- Ekman, P. (1970). Universal facial expressions of emotion. California Mental Health Research Digest, 8, 151-158.
- Ekman, P.; Friesen, W.V. (1986). A new pan-cultural facial expression of emotion. Motivation and emotion, 10(2), 159-168.
- Karkkainen, K., & Joo, J. (2021). FairFace: Face Attribute Dataset for Balanced Race, Gender, and Age for Bias Measurement and Mitigation. In Proceedings of the IEEE/CVF Winter Conference on Applications of Computer Vision, 1548-1558.

Download the original PDF: White paper - FaceReader - FairFace validation (PDF)