Collaboration in science is key. That is why today we are giving the floor to Dr.
Monica Torres-Ruiz, who has created an openly available tool to process data from EthoVision. In this guest blog
she will explain why she created her program DanioFlow and what it can be used for. So, keep reading to learn
more!

Monica Lúcia Torres Ruiz (right) María Muñoz Palencia (left)
Our goal for DanioFlow
Studying thigmotaxis in zebrafish (ZF) larvae taught me that collecting
behavioral data is only half the battle. This is the story of how a PARC project challenge led me to develop
DanioFlow, a free tool to simplify and harmonize EthoVision data analysis.
When I first joined the PARC (Partnership for
the Assessment of Risks from Chemicals
) project, I knew we were aiming high. The goal was ambitious: help modernize neurotoxicity testing by
developing new, ethical, and scalable behavioral methods (Tal et al., 2024). What I didn’t know yet was that
this project would eventually push me beyond experimental design and into the world of data workflows,
reproducibility, and tool development.
At the center of my work was an apparently simple question: can measuring
thigmotaxis in 5-day old ZF larvae add value to neurotoxicity testing, and if so, how do we first set it up as a
reliable assay?
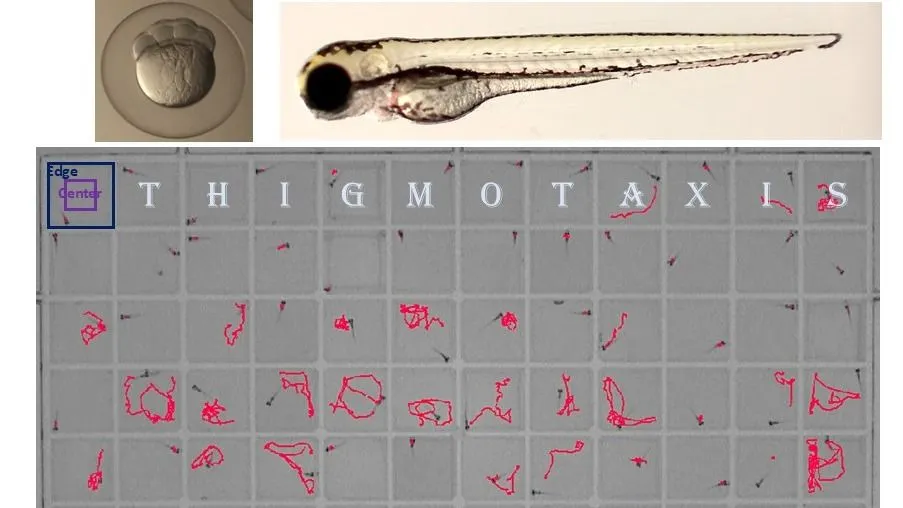
Discovering Thigmotaxis as a powerful readout
Thigmotaxis, an organism’s tendency to stay close to walls, has long been used as
a proxy for anxiety-like behavior (Kraeuter et al., 2019). In zebrafish larvae, it is a conserved and
quantifiable response, but also one that has been applied very inconsistently across labs (Hill et al., 2023).
Comparing studies often felt like comparing apples to oranges: different plate formats, different analysis
strategies, etc.
Within PARC, I was tasked with developing a robust, high throughput thigmotaxis
assay that could realistically be used as part of a neurotoxicity battery (Tal et al., 2024). That meant making
some methodological changes: moving from traditional 24-well round plates to 96-well square plates to increase
throughput, combining visual and acoustic stimuli to probe different neural circuits, and standardizing positive
and negative controls.
The experimental work was demanding, but it became especially rewarding when
testing model compounds revealed that thigmotaxis was more sensitive or captured more effects than traditional
locomotion measures (Torres-Ruiz et al. 2026). However, as the datasets expanded, another challenge emerged.

When analysis becomes the bottleneck
TEAll experiments were done in the DanioVision chamber and tracked using
EthoVision, which is a fantastic and powerful system. However, once you
export the raw data, you are very
much on your own. For a single experiment this is manageable but for large studies encompassing multiple plates,
multiple stimuli, multiple endpoints, and multiple substances, it quickly became overwhelming.
I found myself repeatedly performing the same steps: cleaning files, normalizing
controls, separating light/dark or sound/silence periods, analyzing significant differences, and preparing
outputs for statistics and benchmark dose modeling.
That was the moment I realized that harmonization doesn’t end at experimental
design. It also lives (or dies) in data analysis.
Why I created DanioFlow
DanioFlow was born out of
necessity. I needed a tool that could take EthoVision
outputs and quickly but reliably transform them into analyzed datasets without requiring advanced programming
skills, which I do not have.
What started as a personal workflow in Excel gradually turned into something more
structured. DanioFlow collects metadata, automates data curation and analyses, applies consistent zone
separation, distinguishes between light and sound stimuli, creates graphs, and outputs a clear Word report that
traces back to the original Ethovision data. Most importantly, it does this in a way that is adaptable. If your
experimental design is slightly different, DanioFlow can evolve with it.

I made a very deliberate decision to make DanioFlow free and openly available as
PARC is built on collaboration, and I strongly believe that tools developed with public funding should help as
many researchers as possible. By sharing DanioFlow, my hope is to reduce analysis time and improve comparability
across studies.
A tool for the community, but not yet finished
DanioFlow was built to be transparent and simple in the way it analyzes data and,
of course, it is open to change. Even though at the moment it is designed for a 96 well plate format and
examines thigmotaxis and general locomotion parameters for light and sound stimuli, other researchers could
adapt it to different plate formats, different behaviors, or even entirely different species if needed. I fully
expect it to grow and improve as others use it, question it, and modify it.
For me, DanioFlow is a natural continuation of the thigmotaxis method. Developing
this sensitive behavioral NAM is only truly useful if the resulting data can be analyzed efficiently and
reproducibly.

Looking back and forward
Working in PARC reminded me that methods are living things. They don’t stop at
the protocol or publication but rather extend into how data are handled, shared, and understood by others.
DanioFlow is my contribution to this broader effort. It grew directly from real
experimental hurdles and from many conversations with colleagues facing similar frustrations. If it helps even a
few labs spend less time struggling with spreadsheets and more time thinking about biology, then it has already
done its job.
And honestly? That feels just as rewarding as any significant p-value.
DanioFlow is freely available to the research community and can be accessed via Zenodo. Torres-Ruiz, M. (2026). DanioFlow – Automated Behavioral Analysis Pipeline for Zebrafish Larvae (1.0.0).
Zenondo.
References
Torres-Ruiz M., Muñoz Palencia M., De La Vieja A., Cañas Portilla A. 2026. Visual - Acoustic Thigmotaxis in Zebrafish Larvae: A High throughput NAM for Neurotoxicity Assessment. BioRxiv .02.03.703464.
10.64898/2026.02.03.703464
Hill B.N., Britton K.N., Hunter D.L., Olin J.K., Lowery M., Hedge J.M., et al.,
2023. Inconsistencies in variable reporting and methods in larval zebrafish behavioral assays. Neurotoxicol Teratol; 96: 107163`
10.1016/j.ntt.2023.107163
Hill B.N., Britton K.N., Hunter D.L., Olin J.K., Lowery M., Hedge J.M., et al.,
2023. Inconsistencies in variable reporting and methods in larval zebrafish behavioral assays. Neurotoxicol
Teratol; 96: 107163. 10.1016/j.ntt.2023.107163
Kraeuter A.K., Guest P.C., Sarnyai Z., 2019.
The Open Field Test for Measuring Locomotor Activity and Anxiety-Like Behavior. Methods Mol Biol; 1916: 99-103.
10.1007/978-1-4939-8994-2_9
Tal T., Myhre O., Fritsche E., Rüegg J., Craenen K., Aiello-Holden K., et al.,
2024. New approach methods to assess developmental and adult neurotoxicity for regulatory use: a PARC work package 5 project. Frontiers in Toxicology; 6.
10.3389/ftox.2024.1359507