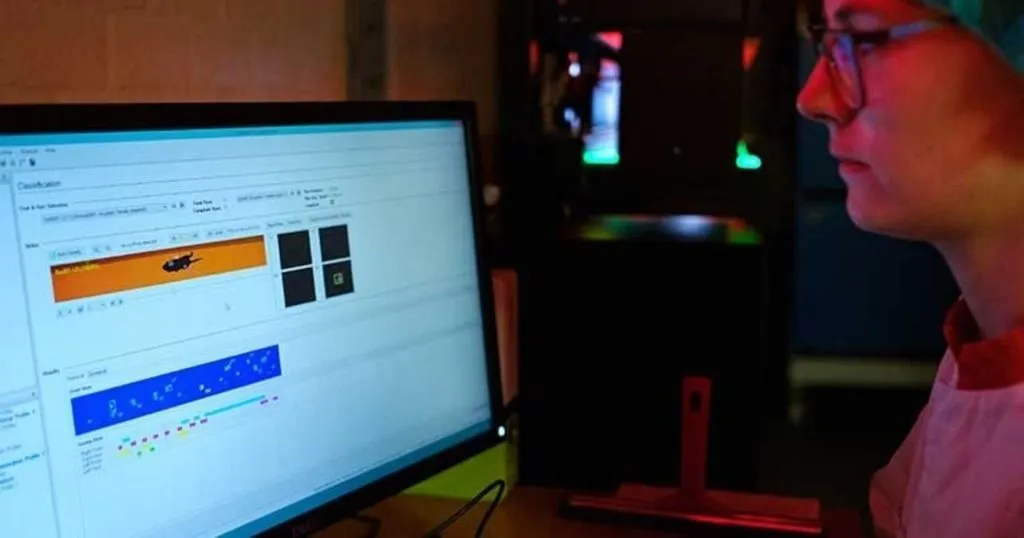
After years of robust and trustworthy service, Noldus is once again innovating their gait analysis system. As a result, the latest update CatWalk XT 10.7 has many quality-of-life improvements and much needed updates to its underlying software architecture, all to prepare it for future improvements and the latest video and AI technologies.
Phase dispersions and coupling revitalized
One of the major things that in need for an update in 10.7 were the way we visualized and calculated the phase dispersions and coupling parameters. Although not wrong, we discovered that the old way of representing these parameters was not intuitive and could lead to the wrong interpretation of their values. Since phase dispersions and couplings are the two most difficult parameters to grasp, and since it requires some basic understandings of circular statistics, we will touch upon those concepts in this blog post a bit more. Therefore, this blog post is for those starting out with gait analysis or seasoned veterans that might need a refresher.
Basics of gait analysis: the gait cycle
Before we start let's review the different parts of the gait cycle. The gait cycle is the repetitive movement of a paw, occurring while the animal is walking. It begins when the heel of the rodent touches the ground (defined as initial contact) and ends when that same heel touches the ground again. The gait cycle can be divided into two phases:
- The stance phase: the paw is touching the ground
- The swing phase: the paw is moving in the air
Rodents are quadrupedal animals and have therefore 4 paws that typically cycle with slightly different offsets from each other. The offset being the start of each paws gait cycle in time as shown in the graph below where the distance in time between the numbers is the offset.

The stance phase can again be divided into 2 phases:
- Braking phase: starts at initial contact and ends when the paw is completely flat on the ground (maximum contact).
- Propulsion phase: begins just after maximal contact and ends when the paw fully leaves the ground.
Since rodents are quadrupedal there are 24 potential sequences of footfalls. However, after taking out mirrored and repeated patterns only three distinct classes remain. The timing of these patterns and thus the distance between two different paw's gait phases is essential in measuring phase dispersions and coupling.

|
Rotate
Ipsilateral + Girdle
(RF – LF – LH – RH)
|
Cruciate
Diagonal + Girdle
(RF – LF – RH – LH)
|
Alternate
Diagonal + Girdle
(RF – RH – LF – LH)
|
Phase dispersion and coupling explained
When trying to understand phase dispersion and coupling you need to consider a pair of paws. What we try to investigate with the phase dispersions and coupling parameters is the offset between a pair of paws. In other words, where in the gait cycle of one paw (the "anchor") does the gait cycle of the other paw ("target") start. The value measured is the offset as a percentage of the anchors gait cycle. The difference between the two parameters can be stated as follows:
- Coupling focuses on the relationship between two paws and their coordination with each other. Because of its definition coupling always falls within 0-100%.
- Phase dispersion focuses on the variability of timing and consistency between gait cycles.
As an example, when the right front paw's gait cycle has a total duration of 20 milliseconds and is considered the anchor, and when the left hind paws gait cycle starts 15 milliseconds after the start of the anchor. This then means that the left hind paw strikes the ground at 75% of the anchor's gait cycle. The value for both the coupling and phase dispersion parameter will be 75%.
Using circular statistics in gait analysis
To calculate the mean phase dispersion value from a set of values within a run, a trial, or a group of animals we need to use circular statistics because the underlying data is of a repetitive nature. Let's consider a simplified example with data from four gait cycles: two times of 75%, and two times of 5%. While linear statistics would give us a mean of 40% [(75+75+5+5)/4], this is not correct.

In circular statistics, data points are plotted on a circle. For phase dispersion, the circle has 0% (and 100%) at the top, moving clockwise you get positive values with 25% on the right, 50% at the bottom, and 75% on the left. Counterclockwise you get negative values. Values like 75% and -25% are therefore the same point on this circle.
Using the example just mentioned, when we plot 5% and 75% on the circle, they are closer together in the counterclockwise direction, making the mean -10% (or 90%), not 40%. Whether the value is -10 or 90% in this example depends on the definition of the parameter. Couplings run from 0%-100% and Phase dispersions from -50% to 75%.
So, for Phase dispersion the value would be -10% but for Couplings it would be 90%. This illustrates the need for circular analysis for this parameter and why we introduced them so interpretation errors can be avoided. With these examples we are just scratching the surface of these parameters and there is much more to learn.
Learn more from a tutorial video!
We can imagine you still need some more information on phase dispersions and coupling or CatWalk XT? This is a good moment to visit your MyNoldus account to watch a more in-depth version of this blog in video form. If you are not already a member of myNoldus it is a great reason to open an account and benefit from all the information that will become available to you. We are excited for the future of CatWalk XT, so stay tuned for updates by following us on social media or by reaching out to us via MyNoldus.
RESOURCES
Read more about CatWalk XT
Find out how CatWalk XT is used in a wide range of studies and how it can elevate your research!
- Free white papers and case studies
- Customer success stories
- Recent blog posts
Resources
arrow_forward