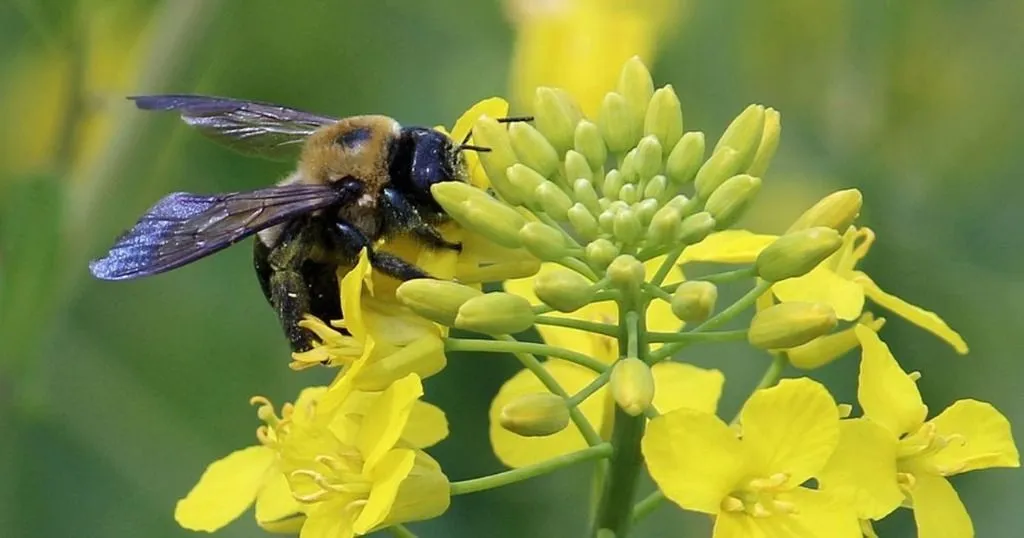
Flower preference in solitary bees
Mason bees are fascinating and friendly creatures. Tibor Bukovinszky and his colleagues investigated how their foraging behavior affects their offspring.
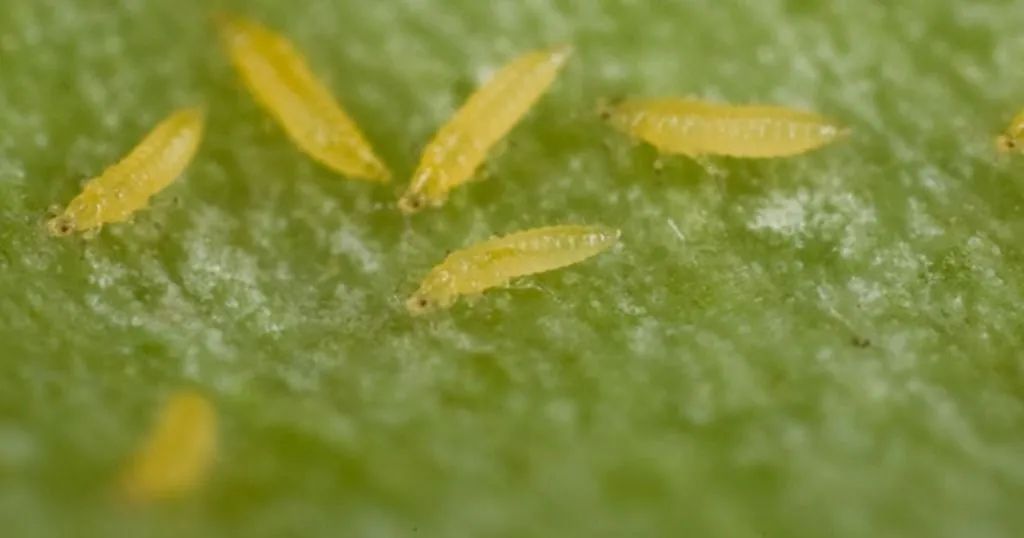
Read More arrow_forwardIdentification of thrips resistance in Arabidopsis. Maarten Jongsma explains how he used EntoLab to facilitate insect choice assays and automate movement tracks

To validate the benefits of the system, two Arabidopsis accessions that were previously analyzed for differential resistance to western flower thrips were contrasted. Jongsma et al. (2019) describe how settings are optimized for the different filters and statistics. The statistics are reported in terms of frequency, duration, distance and speed of behavior events, both as sum totals and event averages, and both for the total trial period and in time bins of 1 h. Also included are higher level analyses with subcategories like short-medium-long events and slow-medium-fast events. The time bins showed how some behavior elements are more descriptive of differences between the genotypes during the first hours, whereas others are constant or become more relevant at the end of an 8 h recording. The three overarching behavior categories, i.e., choice, movement, and halting, were automatically corrected for the percentage of time thrips were detected and 24 out of 38 statistics of behavior parameters differed by a factor 2–6 between the accessions. The analysis resulted in much larger contrasts in behavior traits than reported previously. Compared to leaf damage assays on whole plants or detached leaves that take a week or more to complete, results were obtained in 8 h, with more detail, fewer individuals and higher significance.

Comparison of different two-choice assays to assess plant resistance to thrips (from Thoen et al., 2016).

Determining the behavior state and zone position of thrips. (A) Histogram of the velocity distribution of one thrips in a selected arena to aid in selecting proper thresholds for the determination of movement and halting events (velocity in mm/s); (B) Zoom of 12 arenas of the T-maze array with the two Arabidopsis accessions; (C) View on the left of the 2D arena shape position trace (red line) and on the right the 1D thrips zone position and velocity traces (black line) and movement state (green band for moving and red for halting) for a selected time interval (ca 18min).

Thrips choice behavior statistics in time (A–N). Overview of 14 different statistics that are automatically indexed per hour by EthoAnalysis. The 95% confidence intervals are indicated by blue and green shading (excluding effects of experimental design). The results are based on 39 arenas.
Mason bees are fascinating and friendly creatures. Tibor Bukovinszky and his colleagues investigated how their foraging behavior affects their offspring.
Read More arrow_forward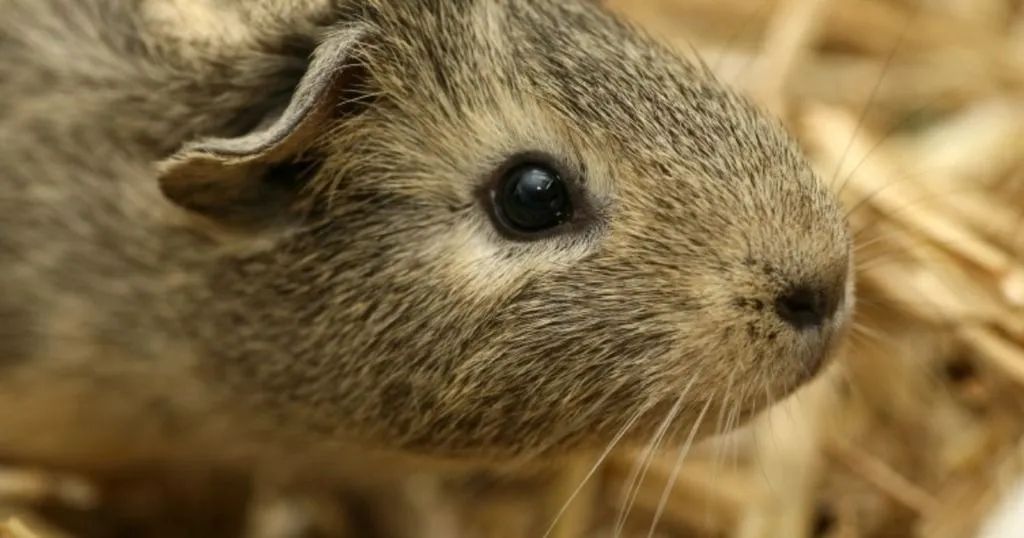
If zebrafish are the new mice, guinea pigs might be the new rats. Guinea pigs differ from mice and rats, and that just might make them more suitable due to the fact that these results are more easily translated to humans.
Read More arrow_forward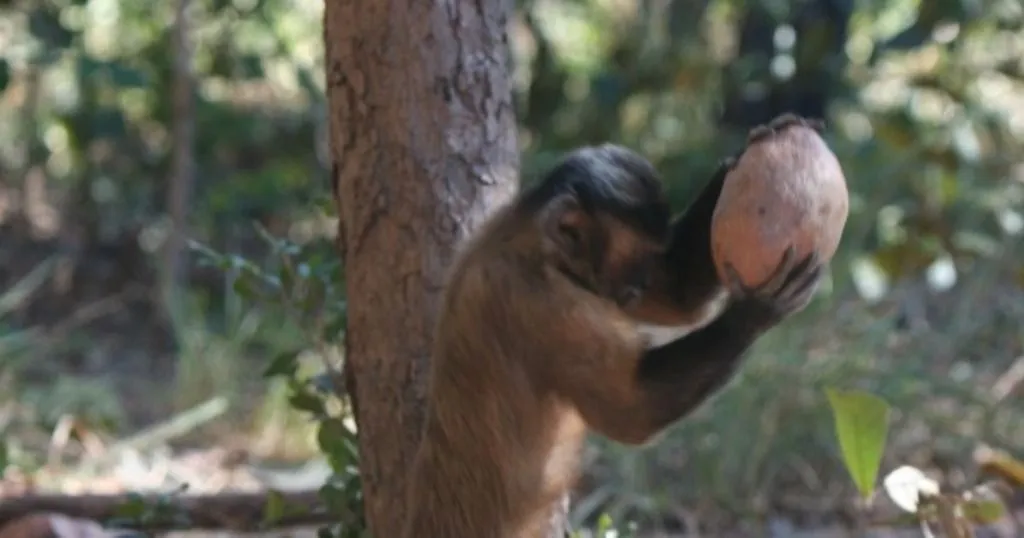
We already know some monkeys display above average intelligence. One way by which we can tell is their use of tools. Studies have shown that capuchin monkeys use boulders and logs as anvils upon which they can crush nuts.
Read More arrow_forwardWe'll get back to you shortly.
Please correct the following errors: