After installing the software and setting up your project, record the complete picture using video and other sensors. Then use the software to:
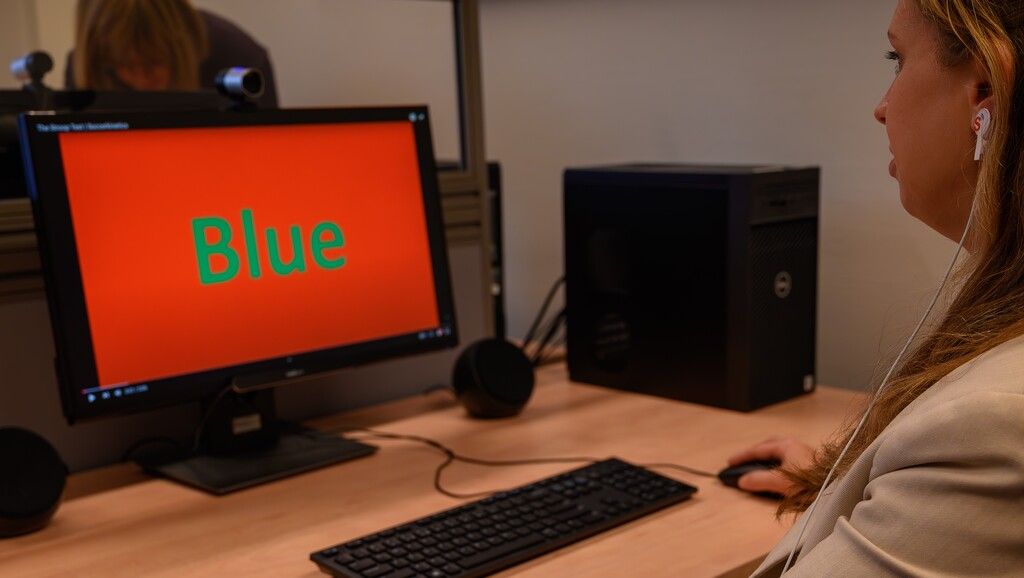
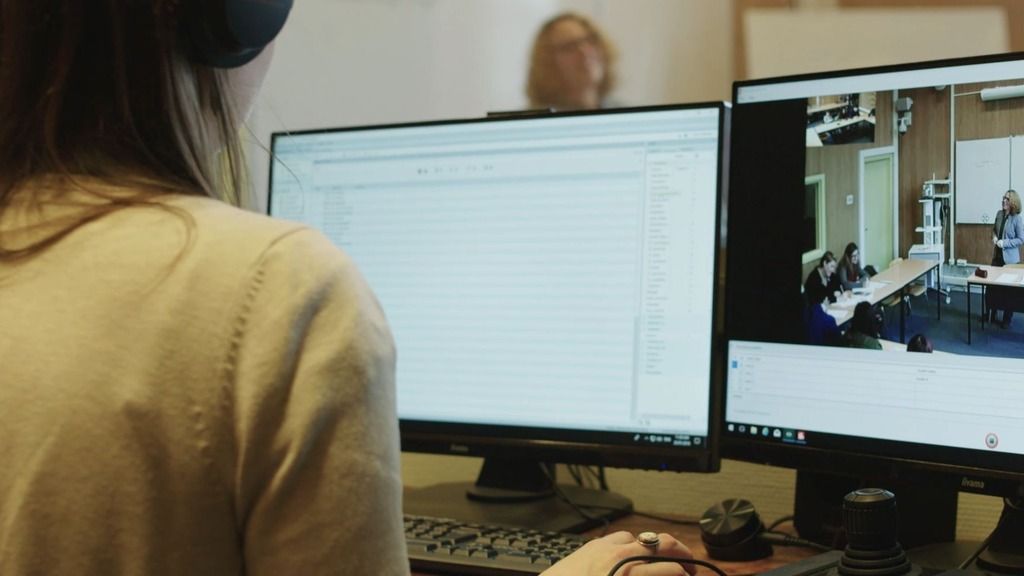
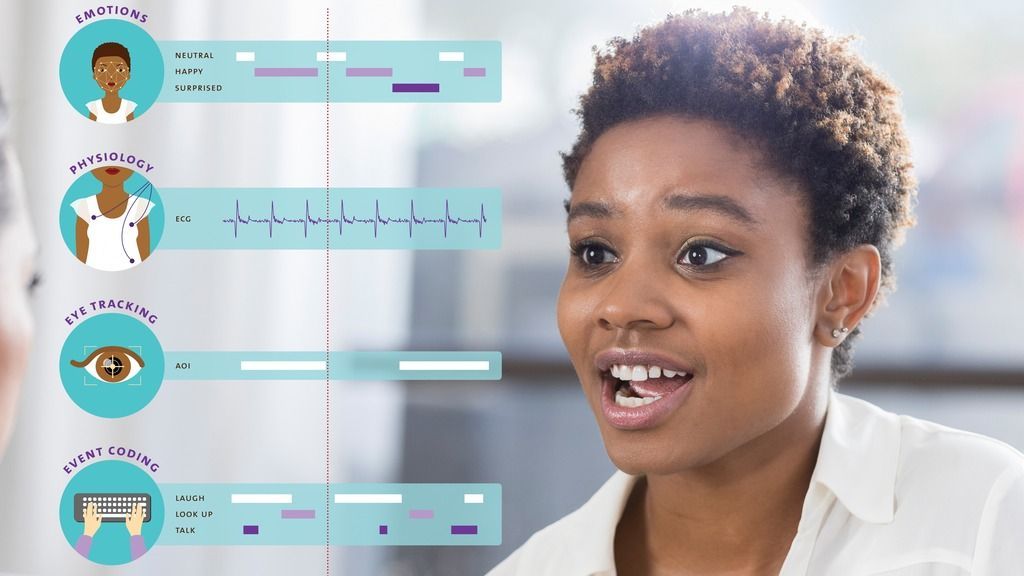
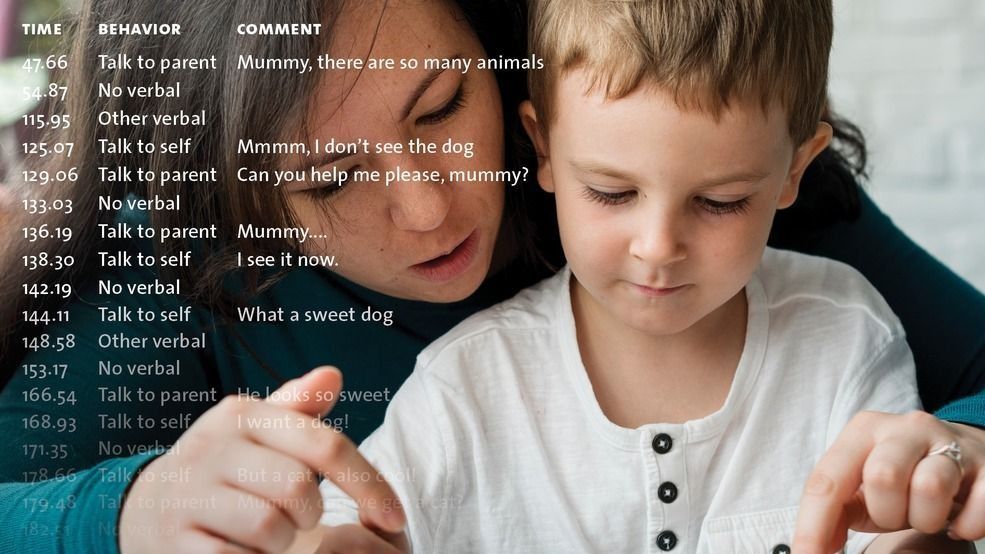
Important factors for the system requirements include the use of video, the amount of data, the complexity of data selections and analyses, and the size of external data files. For optimal performance and functionality, an up-to-date computer system is strongly recommended. The minimum requirements for workstations are: We recommend to remove other software (video recording, editing, or burning) or codecs which could interfere with The Observer. The Observer® allows for: Depending on your research needs, you can extend this with additional functionalities for integration of external data or E-prime, adding capabilities that streamline complex study designs. uLog automatically records user-system interactions, such as: To avoid misuse, uLog shows an icon to inform the user that keyboard logging is active. Starting and stopping of event logging is automatically synchronized. uASQ enhances The Observer® XT with direct feedback from your test participant during a live observation. It enables you to ask three different types of questions: open ended, multiple choice, and Likert Scale. To present stimuli to your test participants, you can use E-Prime in combination with The Observer. E-Prime is the stimulus presentation program widely used in psychological research, for example to test the Stroop effect. E-Prime sends the collected data to The Observer immediately after the session. The collected data is then visualized as behaviors and modifiers, including the time at which the stimulus was given, which stimulus it was, and how the participant responded. Dr. Cole Barton Davidson College, USA The use of video adds great flexibility to behavioral studies. It allows you to make detailed observations and frame accurate descriptions of fast moving phenomena. Use the playback functions to easily position the video, play it back at different speeds, frame by frame, and multiple videos at the same time. You can set a loop in the video and audio files to code this episode, or use the quick review button to take a small step back in the video. In The Observer overt behavior and physiological responses can be studied together. Synchronization of these multiple data streams is key to understanding human behavior. Synchronization is guaranteed. For example with Tobii eye trackers, a Bitbrain EEG wearable, FaceReader, and BIOPAC physiological measurement systems. Sections of the physiological data correlating with interesting behaviors can be exported for further analysis. Designing a coding scheme is a crucial step, since it is the actual measuring instrument. The Observer guides you through the process of building one. If you want to add behaviors, the software instantly shows you what kind of results you can expect. While coding, you can use shortcut key codes to keep up the speed. The time of each code is recorded automatically and errors are prevented by an online check. Imagine children on a playground, customers in a busy supermarket, or visitors in a museum. They are constantly on the move and you need to observe them unobtrusively. In these situations, Pocket Observer is the ideal solution to code behavior. With Pocket Observer, you can record observational data in great detail. And, Pocket Observer makes data coding easy with its user-friendly interface. A Coder license is the ideal solution when you need to work with several people on one research project. Several observers can work on a project at the same time. Using The Observer Coder license allows for coding and visualization only. After all behaviors are coded, you can collect the observations in your main project with a full license and perform data selection, visualization, and analysis.How do I use The Observer?
Try for yourself
arrow_forward
Which hardware do I need?
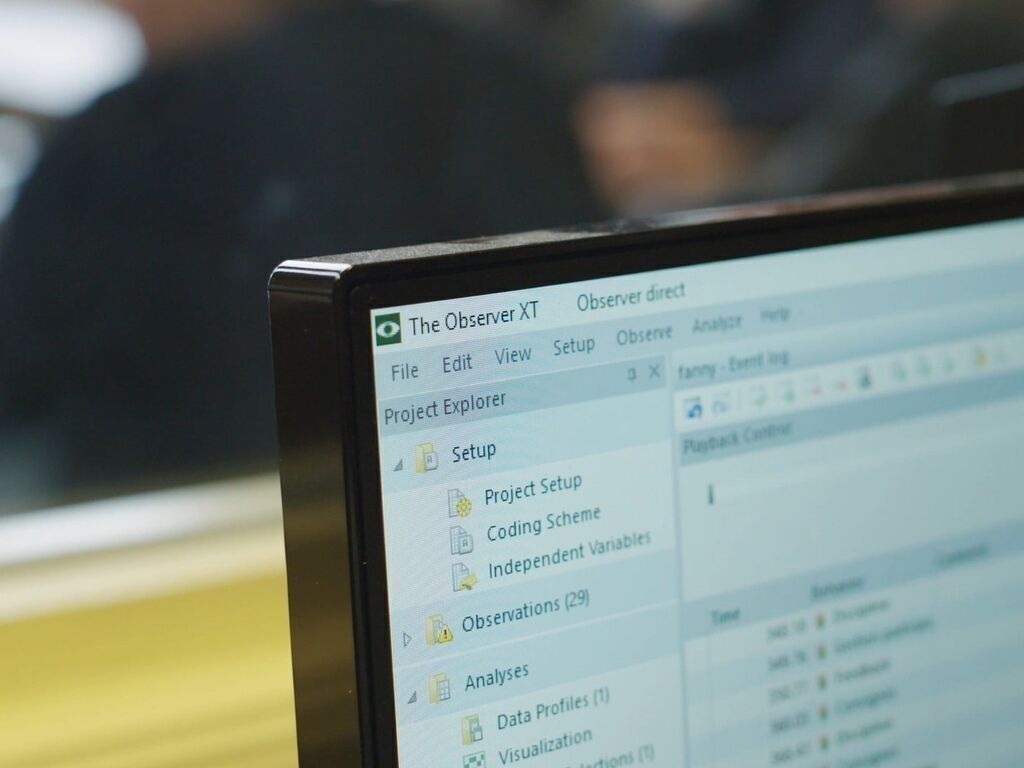
What does the software offer me?
Additional tools
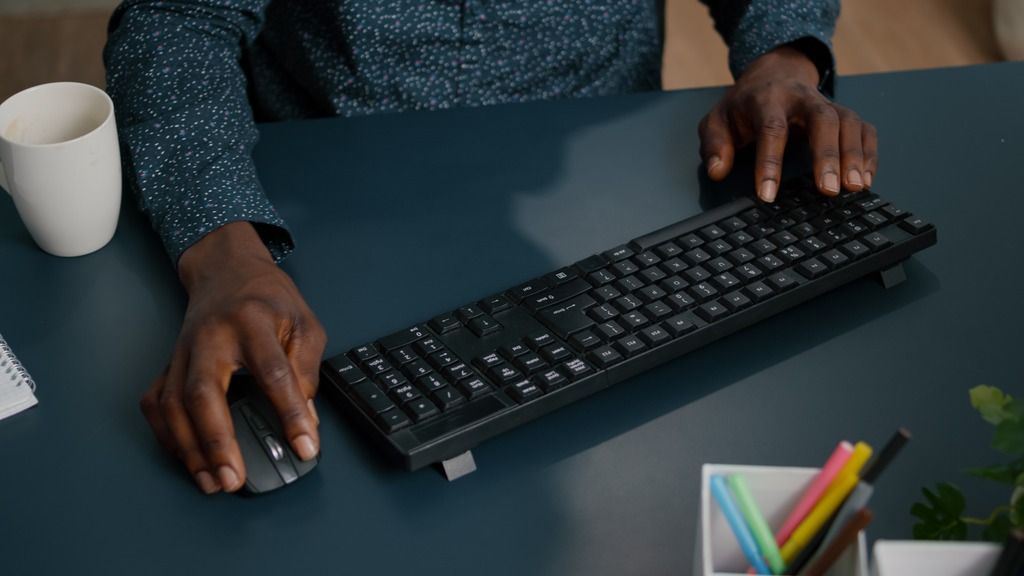
uLog: user-system interaction

uASQ: the questionnaire tool
E-Prime: Stimuli presentation
"The integration of FaceReader, The Observer, and psychophysiological data collection makes research programs possible at locations and within timetables that increase opportunity, quality, and efficiency."
How do I collect my data?
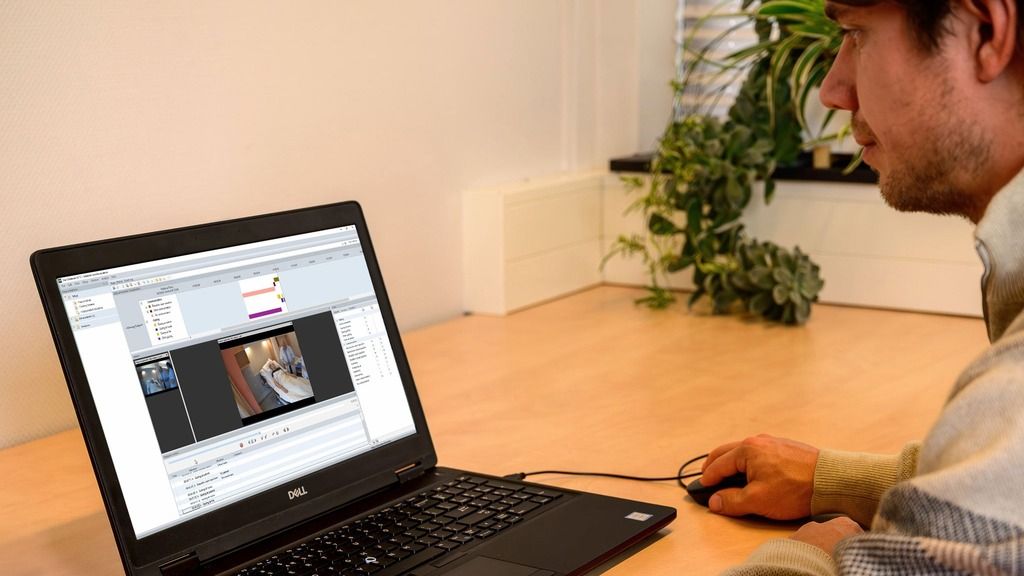
Work with video and audio
Integrate more data streams
Code behaviors accurately
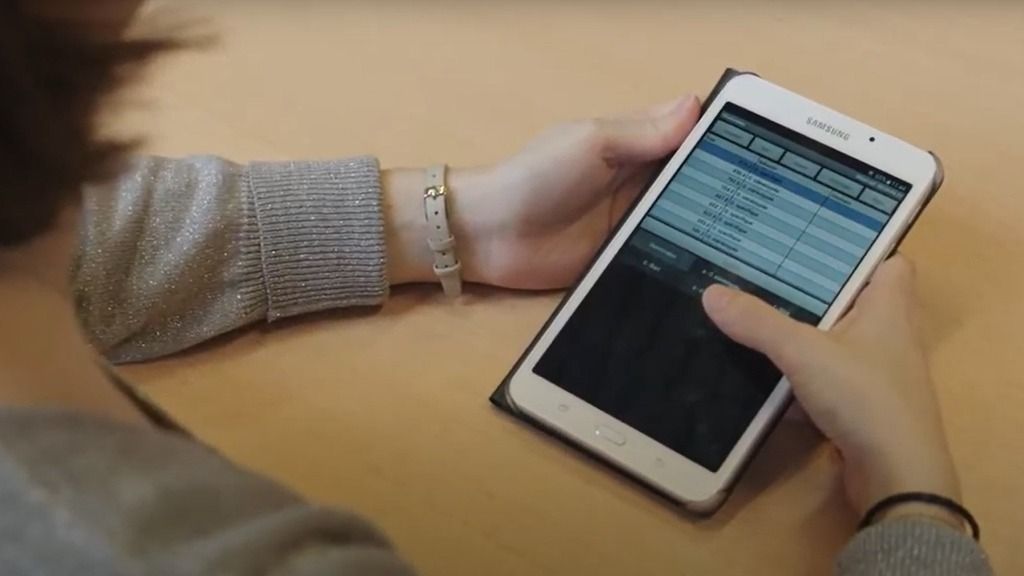
Code on the go

Work together on a project
How do I analyze my data?

Select the right data
You can build elaborate filters based on combinations of independent variables, behaviors, physiological data, and time criteria. Examples of independent variables are treatment, subject ID, observer, and any other important circumstances. All data in the project is available for analysis and ready for export.
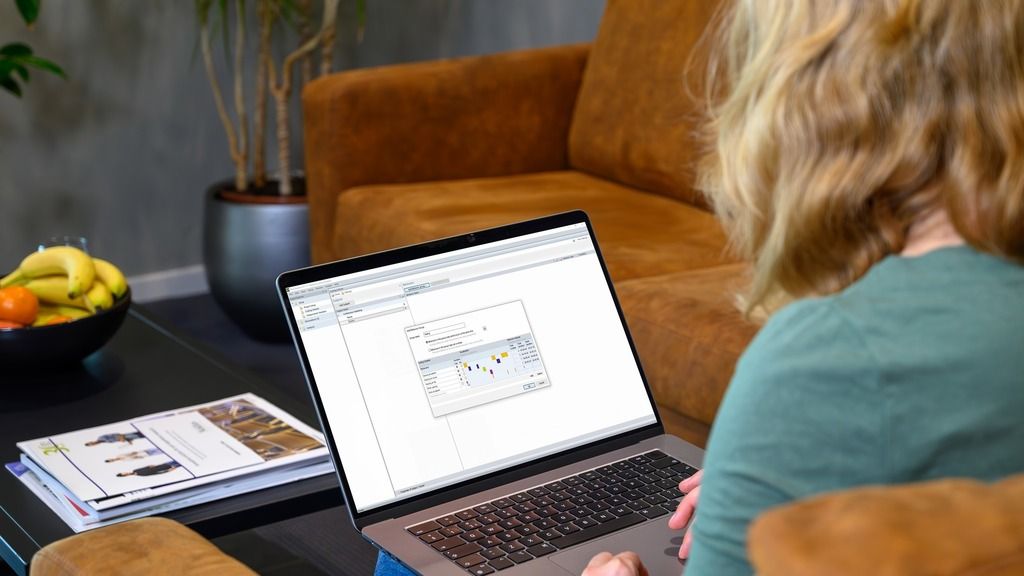
Visualize your data
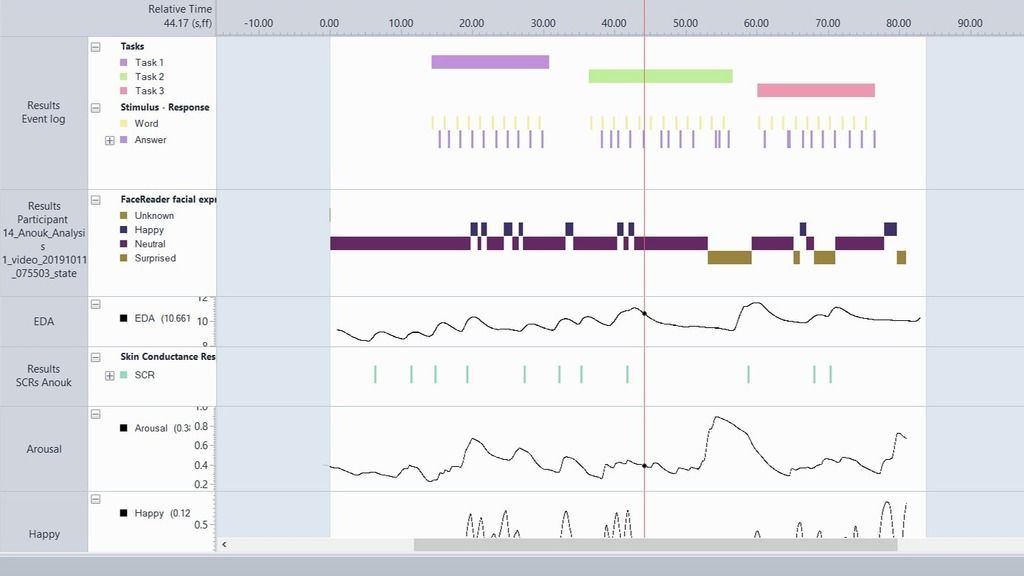
The analysis of data often begins with visualizing the event log, one or more videos, audio, and physiological data streams. All data streams are displayed alongside and play in perfect sync. By visualizing the data streams, you can easily see and present what you have collected. Ready for export for further analysis.
Explore your data
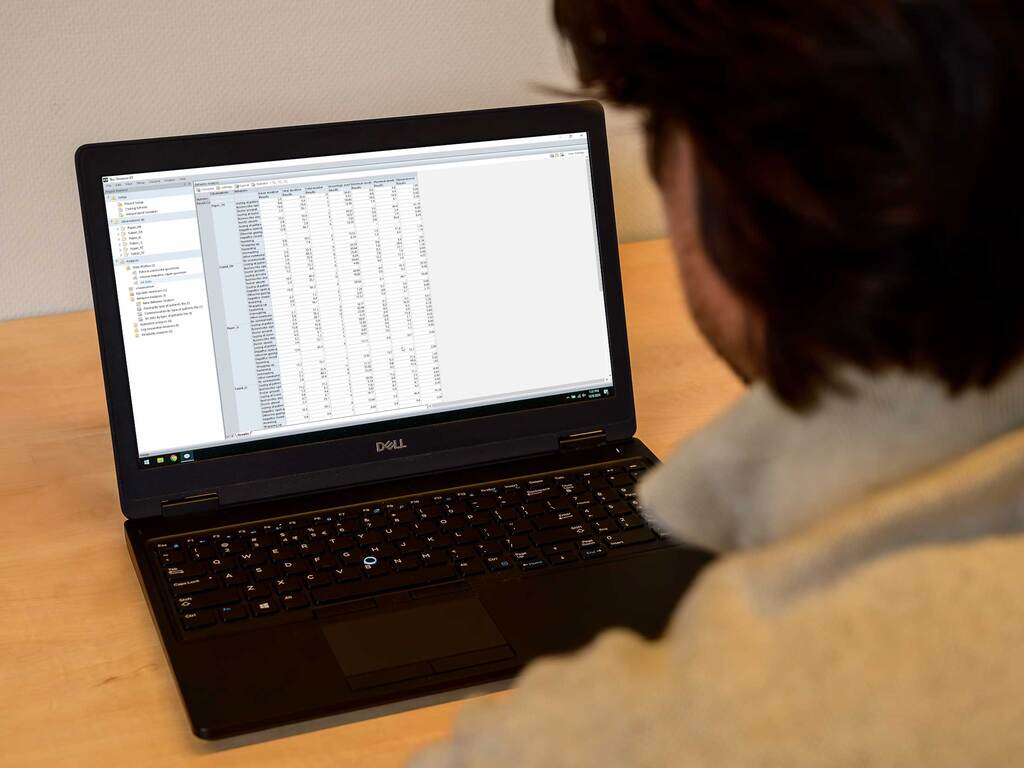
The Observer offers descriptive statistics of the coded behavior. You can calculate frequency and duration of behaviors, statistics for numerical modifiers or numerical external data, which can all be exported if needed. Also, you can perform a lag sequential analysis and a reliability analysis.
Interested in The Observer?
Get in touch!
Want to learn more about setting up The Observer for your research? Contact us for a free demo or pricing information.
Thank you!
We will get back to you within one business day.
Thank you!
We'll get back to you shortly.
Please correct the following errors: