Location is everything: Measuring visitor behavior
Want to know where the action is? Interested in getting real-time feedback about a conference, concert, or event hotspots? Read more about the Crowd Emotion Monitor app.
Posted by
Published on
Mon 23 Feb. 2015

Want to know where the action is? Interested in getting real-time feedback about a conference, concert, or event hotspots?
At the Measuring Behavior conference in August 2014, a number of meeting participants took part in an exciting experiment in which they received real-time updates on their own smartphones about the “hotness” of several conference events. Did this information lead them to the most interesting lectures, booths, or poster sessions?

Crowd Emotion Monitor and SWEET
These conference delegates were the first to test out a special app called the Crowd Emotion Monitor, which they installed on their own phones.
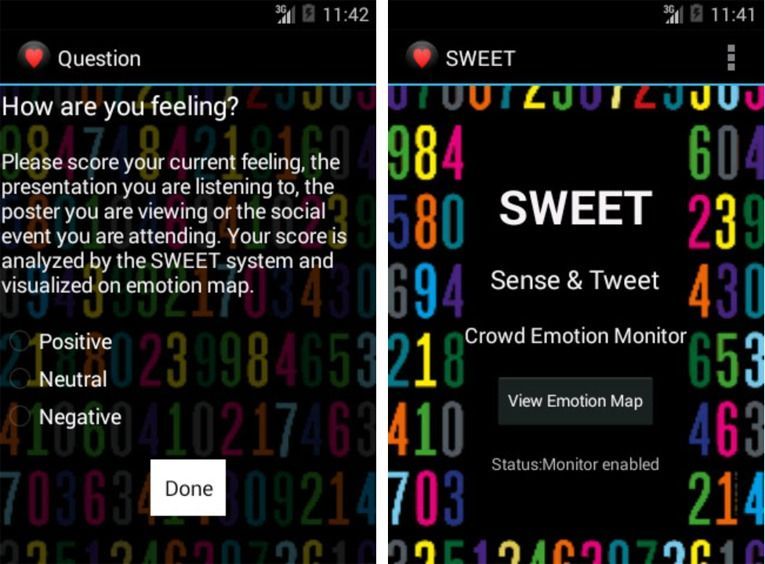
This app was created with the goal of enhancing the overall user experience during conferences and other events. With further development, it could potentially also increase safety at mass events by monitoring the emotion of a crowd. Below you can see examples of the app (screenshots).

SWEET is short for Sense & Tweet. In this project a software tool is being developed that combines state-of-the-art sensory, event processing, reasoning, and data communication technologies. The result is a Crowd Emotion Monitor, an application that assesses the behavior and emotion of groups of people and relays that information to stakeholders in a highly intuitive manner. The Crowd Emotion Monitor is being developed in the context of COMMIT, a Dutch public-private research program in information and communication science. Partners of the consortium are CWI/MonetDB, TNO, University of Twente, VicarVision, and Noldus.
To quote Lucas Noldus in I/O Magazine about the technique:
"For example, during a conference, smartphone cameras will measure facial expressions of visitors. This large amount of data is sent to servers. There, data information gets translated real-time into information and is sent back to the smartphone at that conference. By doing so, now all new participants on that conference are able to check on their smartphone on all these different emotions that are taking place at all different parts of the conference. With this information they can pick choose for the part of the conference that appeals to them the most."
Measuring consumer or visitor behavior
Combining information from many mobile devices at once makes it possible to gauge the reactions of a crowd. The SWEET app measures location, emotion (of the phone user or others), and subjective feedback via a participant survey in order to draw a complete picture. TrackLab could help researchers gain insight into spatial behavior by combining all the tracks (visitors at a conference moving around).
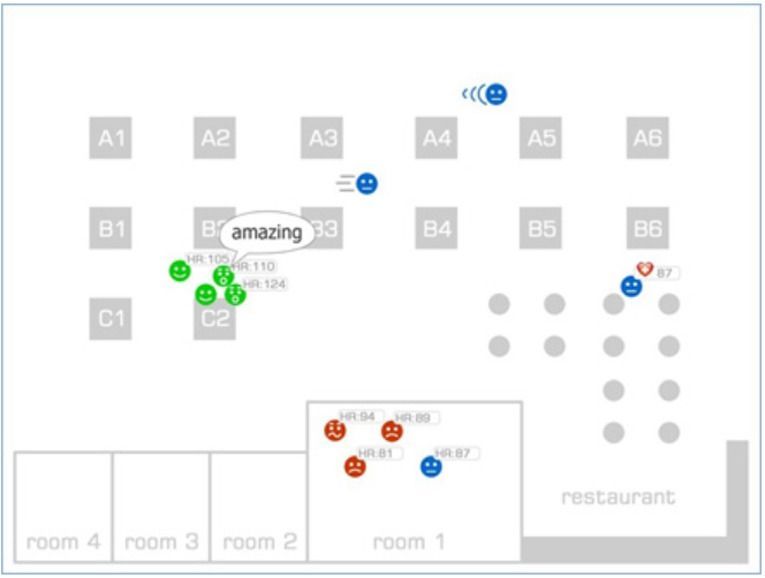
During an experiment, participant responses are used to give real-time feedback, with the idea that users will flock to the location with the most positive ratings. The app shows an ‘emotion map’ of the conference venue, using the combined data to generate a visual heat map and indicate hotspots.
More to come
The experiment at Measuring Behavior 2014 demonstrated how multimodal measurements can create insight into group processes. It also inspired the participants to think about other applications of this new technology. Back to the original question: Did this information lead them to the most interesting lectures, booths, or poster sessions? Not that many people participated, but the SWEET development team received useful feedback regarding the pros, cons, and added value of this type of data collection and analysis.
Want to follow the development of SWEET? Check out COMMIT’s website.
Save the date!
More information about upcoming Measuring Behavior conferences on www.measuringbehavior.org or join the Measuring Behavior group on LinkedIn.
Related Posts

Why measuring behavior is awesome (+3 examples to prove it)

Autism Top 8 Blog Articles from the Behavioral Research Blog

