Five studies showing the power of multi-modal data in behavioral research
The advantages of using multimodal data over a single modality are that it reveals deeper insights and also if one modality fails there can be enough redundancy in the data to still make sense of it.
Posted by
Published on
Mon 13 Dec. 2021
Topics
| Alzheimer's Disease | Child Development | Dementia | Developmental Psychology | EEG | Healthcare | Heart Rate | Physiology | Rats | Social Behavior Research | Social Interaction | Stress | Data Integration | EthoVision XT | Labs | Observational Research | The Observer XT | Video Observation | Multimodal Research |
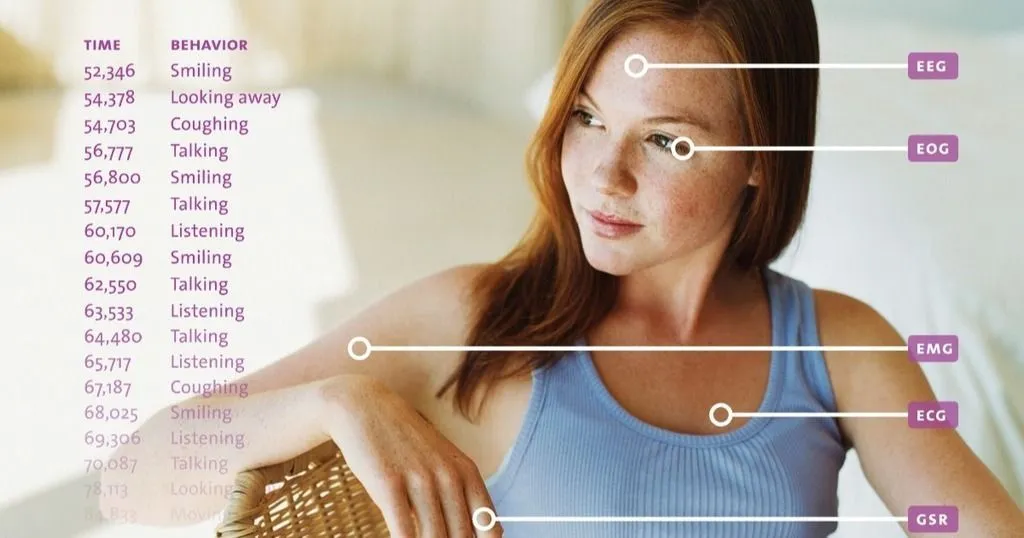
In recent years, a major trend in behavioral research has been the adoption of multi-modal measurements. Whereas in the past an observation, or even computer-aided video observation, might have been sufficient to answer the research question, today’s scientists need to gain deeper insights. Multi-modal data can help with that.
Case studies showing the power of multi-modal data collection
An observation can tell you what someone is doing, but the insights into mental states given by physiology can tell you why they are doing it. For example, eye tracking can reveal patterns of interest that the subject themselves are not even aware of and EEG can give insights into detailed brain processes.
One reason that researchers use multi-modal methods more than in the past is that modern solutions like The Observer XT, or the newly released all-in-one platform NoldusHub, make it easier to integrate and synchronize different data streams and harness the power of multimodal research.
Here are five different examples of research that would not have been possible without combining different data modalities.
1. Developmental psychology — Investigating social anxiety with video observations together with PPG and temperature sensors.
Social anxiety is something that we have all experienced. Public speaking, job interviews, and dates are all circumstances that can make us feel anxious and fear what others will think of us. Sometimes that is accompanied by blushing – the face reddens and feels hot. Everyone knows that, but what was not known until a recent study [1] by psychologists from the University of Amsterdam what role blushing plays in an extreme version of this; social anxiety disorder (SAD).
That disorder is characterized by an extreme and persistent fear of negative evaluation by others. It severely interferes with social situations and can have all sorts of negative knock-on effects. It is known that blushing is a symptom of SAD and can help maintain it, but what is blushing’s role in its development?
The researchers asked young children of various ages to sing a song in front of them. They combined systematic observations using audio-video recordings with The Observer XT with measurement of blushing using a combination of three techniques. Blood volume and blood pulse amplitude were measured using photoplethysmography (PPG).
This is the same sort of technique to that used in sports watches to measure heart rate, where light is shone into the skin and the reflected signal is then processed (see diagram below). Cheek temperature was measured using a platinum electrode. Both the PPG and temperature sensors were fastened to one cheek of the children.
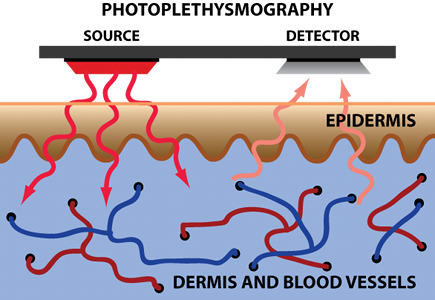
Image from Gudi A. Tasli HE, Spink AJ & Theuws JH (2015). 11th Pangborn Sensory Science Symposium
It is clear that for a study like this, the combination of video observations and using sensors to measure a specific variable (in this case, blushing) had a considerable added value. If blushing had just been estimated by observations, it would have been far less accurate, and data would have been missed.
Observations alone would not have been able to quantify the extent of the blushing; it would have only revealed its presence or absence. That would have considerably restricted the analysis possibilities.

The exact relationship between blushing and social anxiety disorder is a complex one. For the details, you will need to read the paper [1]. However, it was clear the development of self-conscious emotional reactivity (shown by blushing) by children in early childhood can be an important influence on the development of SAD in late childhood.
The three different ways of measuring blushing indicated different aspects. Temperature showed the clearest relationship with social anxiety development – probably because the children can feel their cheeks getting hot and become self-conscious about the situation.
2. Neuroscience — Brain waves in rodents
EEG is a technique which places electrodes on the surface of the skull and which are able to pick up the electrical activity of the neurons in the brain. The activity goes up and down in a waveform, and how fast the wave oscillates, is correlated with what the subjects are doing.
If it is 8-12 times a second (8-12 Hz), then that is related to relaxed behavior. That was the first association to be found, and so they are called alpha waves. Beta waves (16-31 Hz) indicate active thinking (alertness) and motor behavior, theta (4-7 Hz) drowsiness and meditation, delta (less than 4 Hz) high attention and deep sleep. Gamma waves (shown in the diagram below) are quite high frequency, 30-100 Hz, and are caused by groups of neurons acting together for certain cognitive and motor functions.

EEG Gamma waves By Hugo Gambo - Own work, CC BY-SA 3.0,
The EEG is often associated with a particular location, e.g. alpha waves are measured at the posterior (back) regions of the head. It is also possible to look in much more detail at EEG waveforms, for example one of the stage of sleep is called REM sleep – rapid eye movement. The movements of the eyes result in very specific shapes in waveforms from equally specific regions of the brain. By looking at these waveforms, it is possible to tell not only that REM sleep is going on, but also in which direction which individual eye is moving at a particular moment [2].
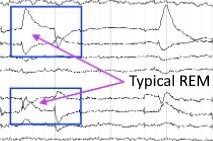
Typical REM sleep EEG patterns (from [2]).
EEG can also be used to help understand what is going on in diseases of the brain like Alzheimer’s and depression.
There are a lot of similarities between the EEG of humans and other animals including rats and mice. Often there are also fine differences like peak latencies but the general pattern of, for instance, the response to various drugs are rather similar [3]. This means that it is often used in drug discovery.
A group of researchers in Chile studied gamma waves in the EEG of rats [4]. They looked at these in the area of the brain called the nucleus accumbens. That area is part of the reward system of the brain and it is related to the experience of pleasure. Dopamine is an important neurochemical in that region. In that study, the scientists combined measurement of the EEG of the nucleus accumbens with behavioral measurements which were made using EthoVision XT.
Two rats were allowed to interact with each other in an open area that was neutral territory for both animals. There were more gamma waves, indicating reward and pleasure, when the rats interacted with each other, than then they were just given a novel object to interact with. Note that this can only be measured by combining the behavioral data from EthoVision XT with the EEG data. In the illustration below (by kind permission of the authors of [4]) the graph on the bottom right shows how the gamma waves are clearly are more powerful when the rats are interacting with each other.
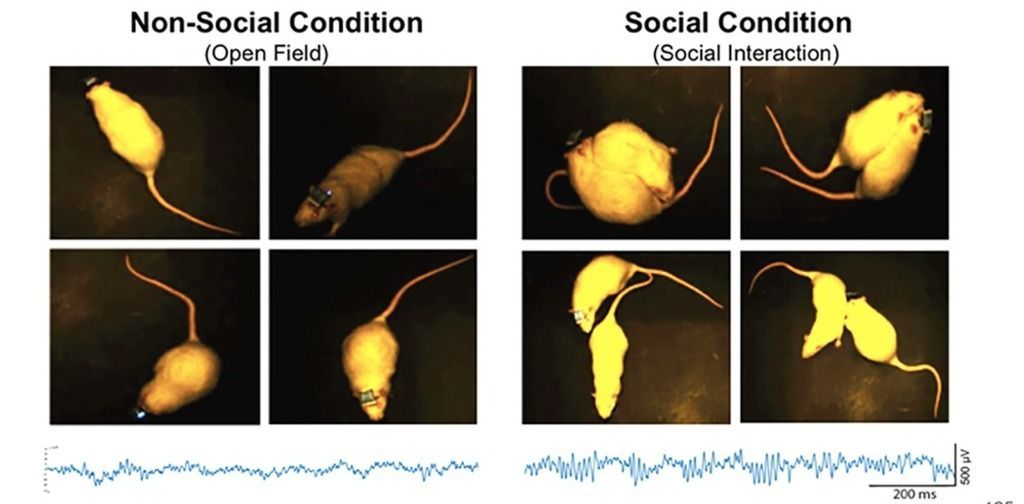
They also looked at how the interaction went when one of the two rats interacting had been stressed. The stress was caused by being introduced to the territory of another rat. This leads to a stressful confrontation. It is the sort of stress that rats in the wild will experience frequently in their everyday lives. The data showed that the stressed rats were no longer able to gain as much pleasure from the interactions on neutral territory as they would otherwise have done. That is not very surprising, but its importance was that it showed, for the first time, some of the details as to exactly how that works in the brains of the rats.
3. Educational psychology — Studying engagement whilst learning using many data modalities.
The NeuroLab at the University of Quebec in Montreal was established to research various aspects of education and learning using multi-modal techniques. They use a whole battery of techniques to study test subjects who are working on online learning problems [5].
The interaction with software (mouse clicks and movement) are recorded. Eye trackers record gaze and pupil diameter. Emotional engagement was measured using FaceReader and electrodermal conductivity (EDA, also known as skin conductivity). This works on the principle that you sweat when aroused or nervous. In addition EEG is used. As mentioned above, beta waves give an indication of cognitive alertness. This was combined with information from alpha and theta bands to give an engagement index. All these data streams were combined together using a special setup from Noldus, as explained in this interview:
Synchronization is especially important in a setup like this, otherwise it is impossible to make a meaningful analysis of the data.
4. Behavioral ecology — Studying stress in trapped badgers
Studying the behavior of animals in the wild has particular challenges and use of multiple types of data can also help there. When working outside the laboratory, it is more common for equipment to fail and to have missing data, so having several types of data can be a way of compensating for that and still being able to get publishable results, even if not all goes according to plan. That was what a group of Swedish scientists found in their study [6] of how stressful being trapped was for badgers.

Image by hrw1973 from Pixabay
Even if the trap is designed so that there is no physical damage, it is still stressful for the badger, because of the way that they perceive the situation. The gold standard for measuring stress levels is to measure cortisol. Cortisol is a hormone produced by the body directly in response to stress.
The researchers put food out for the badgers containing small indigestible colored pellets. Each badger got different colored pellets, so when the researchers collected their droppings, they could measure the cortisol and know which badger it was from. But, as is common in fieldwork, things didn’t turn out as planned. A lot of the samples they collected didn’t have any colored markers in them, so they couldn’t be used.
Live and video-recorded observations using The Observer XT
However, fortunately they didn’t only rely on cortisone measurements. They implanted sensors which enabled them to measure both heart rate and body temperature, which are also indicative of stress (although that is more complex to interpret because those measures also increase with activity). In addition, they made both detailed live and video-recorded observations of all the behaviors of the badgers using The Observer. This was far from trivial, as badgers are nocturnal animals and it involved many nights of painstaking work.
The results were not surprising, though nevertheless important from an animal welfare point of view. Being trapped was indeed very stressful for the animals. All the time they were in a trap they were trying hard to escape. The stress effects continued afterwards; when they returned home they had less social interactions and less “comfort behaviors” like preening and scratching. Three nights later, they still had less social grooming. The longer they were trapped, the more stressful it was. Also if they were trapped at nighttime (their active period), that was more stressful than if they were trapped during the day.
What this study showed particularly nicely was the combination of behavioral observations, physiological measurements, and hormonal observations all contributed to the complete understanding of the experiment and gave much deeper insights that just observations alone would have done.
5. User experience and health research — Use of multimodal data to study how people with dementia can be helped by technology
Two labs in Canada have worked together to develop methods for studying the use of mixed reality (MR) technologies (virtual reality and augmented reality) [7]. The labs are the Social and Technological Systems (SaTS) lab and the Dementia Ageing Technology and Engagement lab (DATE), both in Toronto, Canada. The particular application that they studied was how those technologies can support people with dementia. Normally when developing technologies, users can be asked to fill in questionnaires to give feedback on whether the technologies meet their needs. However, people with dementia are not always able to do that, so observational methods need to be used.
The basis for the observations was The Observer XT, using the special remote licenses supplied to customers during the pandemic. That was used to make a detailed coding of what exactly the participants were doing when they were using the mixed reality (MR) devices.
However, that was not sufficient to get the insights the researchers needed. They also measured gaze and pupil data with eye tracking glasses, emotions expressed in the face with FaceReader and also EEG for measuring neurological processes in the brain. In addition, a task assessment tool was created in order to quantify to what extent the participants were able to carry out the tasks both with and without using the MR tools. Finally, the data were all brought together, synchronized and integrated using The Observer XT.
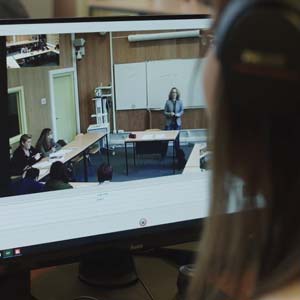
The conclusion of the study [7] was that the MR devices were indeed helpful and also that the multi-modal setup powered by The Observer XT was a useful way of studying the interaction of the participants with the technologies. Involvement of end users of technologies in developing new technologies is critical if the technologies are to be developed in such a way as to meet the needs of those people. Good studies of people who are using the technologies are the best way to determine that.
Conclusions
Use of data from many different modalities is really taking off. The advantages over a single modality are that it reveals deeper insights and also if one modality fails there can be enough redundancy in the data to still make a good publication. A few years ago, working with multimodal data was very complex, especially when it came to integration and synchronization. Modern technologies like The Observer XT increasingly make it easier and more practical.
References
[1] Milica Nikolić, Mirjana Majdandžić, Cristina Colonnesi, Wieke de Vente, Eline Möller, and Susan Bögels (2020). The unique contribution of blushing to the development of social anxiety disorder symptoms: results from a longitudinal study. J. Child Psychology & Psychiatry 61, 1339-1348. doi:10.1111/jcpp.13221.
[2] https://www.learningeeg.com/normal-asleep
[3] Drinkenburg WH, Ruigt GS, Ahnaou A. Pharmaco-EEG Studies in Animals: An Overview of Contemporary Translational Applications. Neuropsychobiology. 2015;72(3-4):151-64. doi: 10.1159/000442210. Epub 2016 Feb 23. PMID: 26901596.
[4] Iturra-Mena AM, Aguilar-Rivera M, Arriagada-Solimano M, Pérez-Valenzuela C, Fuentealba P and Dagnino-Subiabre A (2019) Impact of Stress on Gamma Oscillations in the Rat Nucleus Accumbens During Spontaneous Social Interaction. Front. Behav. Neurosci. 13:151. doi: 10.3389/fnbeh.2019.00151.
[5] P Charland, PM Léger, S Sénécal, F Courtemanche…(2015) - Assessing the multiple dimensions of engagement to characterize learning: A neurophysiological perspective. JoVE, 101, e52627. doi:10.3791/52627.
[6] Schütz, K. E., Ågren, E., Amundin, M., Röken, B., Palme, R., & Mörner, T. (2006). Behavioral and physiological responses of trap-induced stress in European badgers. The Journal of Wildlife Management, 884-891.
[7] Desai, S., & Astell, A. (2021). Mixed reality technologies for people with dementia: Participatory evaluation methods. arXiv preprint arXiv:2107.07336.
Related Posts

What is cognitive load, and how does it help us understand human behavior?

How to easily apply multimodal measurement during research with children
